Linux traceroute命令原理及使用方法(显示数据包在到达指定目的地的过程中所经过的路径和每一跳的延迟)(跟踪路由跟踪)windows tracert命令(功能类似)
Dontla 2024-06-17 11:37:01 阅读 63
文章目录
Linux traceroute 命令原理及使用方法traceroute命令与ping命令区别原理解析数据包路由跟踪生存时间(TTL:time to live)ICMP 和 UDP 安装方法更新包列表安装 traceroute验证安装 使用方法基础使用示例(如果出现`*`表示可能存在问题(并非绝对))用 net 模式的虚拟机 192.168.200.50 去 traceroute 我笔记本 wlan 的 ip 192.168.200.112(虚拟机能ping通笔记本ip)(能ping通但不能traceroute通)用桥接模式的虚拟机(ip独立) 192.168.1.140 去 traceroute PC的 ip 地址(虚拟机能ping通 PC ip)(能ping通也能traceroute通)用net模式的虚拟机 192.168.200.50 去 traceroute baidu.com(虚拟机能ping通baidu)(能ping通但traceroute不通)用桥接模式的虚拟机(ip独立) 192.168.1.140 去 traceroute baidu.com(虚拟机能ping通baidu)(能ping通也能traceroute通)解读 参考文档:选项和参数(`traceroute --help`)英文中文 示例与输出解读 疑难技术点解析路由器不响应问题* 表示的含义最后一跳通常不显示 实际案例演示示例120240529 示例2
Linux traceroute 命令原理及使用方法
Linux 中的 traceroute 命令是一个网络诊断工具,它用于显示数据包从本地计算机到目标主机所经过的路径。这个命令在网络故障排查和性能分析中非常有用。
traceroute 命令的主要目的是显示数据包在到达指定目的地的过程中所经过的路径和每一跳的延迟。
traceroute命令与ping命令区别
尽管 traceroute 可以提供网络路径的洞察,但它并不直接检测目标是否可以“ping通”(即是否可以成功地使用 ICMP Echo Request 和 Echo Reply 进行回音请求/响应)。traceroute 通过逐步增加 TTL 值来发现到达目标主机的路由,而 ping 是用于检查与目标主机的连通性并且量化延迟的工具。
原理解析
数据包路由跟踪
当一个数据包从源主机发送到目标主机时,它需要经过一系列的路由器。每个路由器都会对数据包进行处理,并将其转发到下一个路由器,直至到达目的地。traceroute 利用了互联网协议(IP)中的生存时间(TTL)字段来确定这些路由器的位置。
生存时间(TTL:time to live)
TTL 是 IP 头部的一个8位字段,用于限制数据包在网络中的寿命。每当数据包经过一个路由器,它的 TTL 就会减少1。当 TTL 减少到0时,数据包就会被丢弃,并且路由器会发送一个 ICMP “Time Exceeded” 消息回源地址。
ICMP 和 UDP
traceroute 可以使用 ICMP 或 UDP 数据包来进行追踪。默认情况下,Linux 下的 traceroute 使用 UDP 数据包,而 Windows 下的 tracert 命令使用 ICMP 回显请求。
安装方法
以 Ubuntu 20.04 为例,如果系统没有预装 traceroute 命令,可以通过包管理工具 apt 来安装。以下是安装 traceroute 的步骤:
更新包列表
打开终端(Terminal)并运行以下命令来更新本地的包列表。这将确保你安装的是最新版本的软件包。
sudo apt update
安装 traceroute
使用以下命令安装 traceroute:
sudo apt install traceroute
系统可能会要求你确认安装。通常按下 Y 键后回车即可继续。
验证安装
安装完成后,你可以运行 traceroute 命令加上 -V 或 --version 参数来检查其版本,从而验证是否安装成功:
traceroute -V
如果安装成功,该命令将输出 traceroute 的版本信息。
使用方法
基础使用
traceroute <目标主机>
此命令会输出从本地计算机到指定目标主机之间的所有路由器的 IP 地址和响应时间。
示例(如果出现*表示可能存在问题(并非绝对))
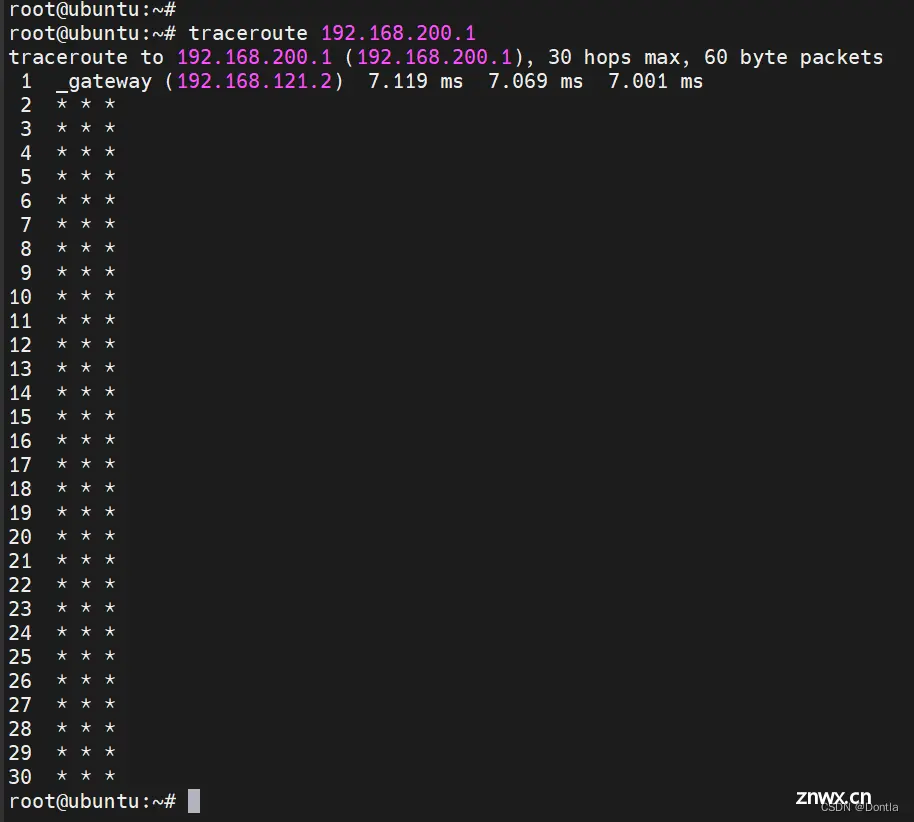
用 net 模式的虚拟机 192.168.200.50 去 traceroute 我笔记本 wlan 的 ip 192.168.200.112(虚拟机能ping通笔记本ip)(能ping通但不能traceroute通)
traceroute 192.168.200.1
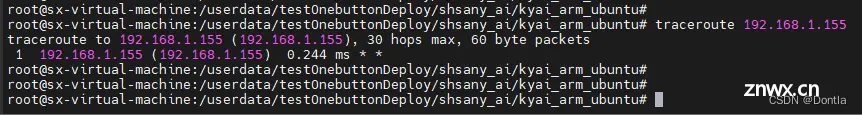
用桥接模式的虚拟机(ip独立) 192.168.1.140 去 traceroute PC的 ip 地址(虚拟机能ping通 PC ip)(能ping通也能traceroute通)
用net模式的虚拟机 192.168.200.50 去 traceroute baidu.com(虚拟机能ping通baidu)(能ping通但traceroute不通)

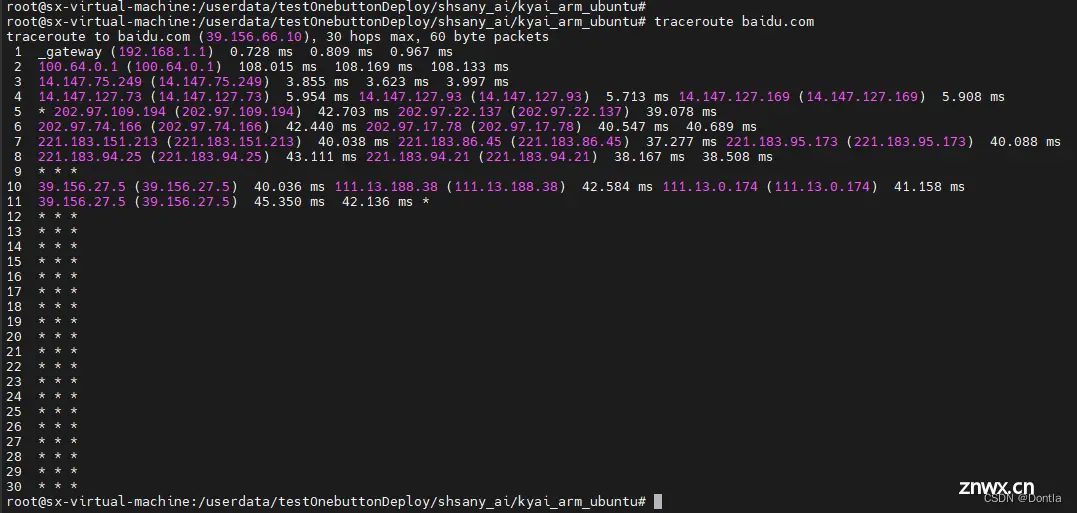
用桥接模式的虚拟机(ip独立) 192.168.1.140 去 traceroute baidu.com(虚拟机能ping通baidu)(能ping通也能traceroute通)
解读
上述 traceroute 命令结果显示了从虚拟机到 baidu.com 的网络路径。下面是对输出的分析:
第1跳:数据包首先到达本地网关(_gateway),IP 地址是 192.168.1.1,响应时间很快,低于 1 毫秒。
第2跳:接着到达了 IP 地址为 100.64.0.1 的节点,响应时间大约在 108 毫秒。这个地址属于共享地址空间(用于运营商的内部网络中),表明数据包已经离开了本地网络,进入了运营商的网络。
第3跳至第8跳:数据包经过了几个不同的节点,这些节点的 IP 地址显示了它们可能属于国内的某些互联网服务提供商(ISP)。响应时间相对较短,表示没有显著的延迟或丢包。
第9跳:开始出现响应丢失的情况,表明这个节点未能发送回响应,或者响应被过滤掉了。
第10跳和第11跳:再次出现了一些有响应的节点,响应时间在 40 到 45 毫秒之间。
第12跳至第30跳:所有后续的跳都没有响应。这种情况通常意味着沿途的设备配置为不回复 traceroute 请求,或者数据包到达了目标但目标网络的安全策略阻止了响应的返回。
虽然最后一段的路由信息缺失,但这并不一定表示网络连接有问题。只要可以正常访问 baidu.com,这些 * * * 就不一定是问题的指示。如果无法访问,这可能需要进一步的调查。
总体来说,这个 traceroute 输出显示了一条到达 baidu.com 的路径,但并没有完整到达目标主机。这很可能是因为路径上的一些节点或最终目的地对 traceroute 发出的数据包类型进行了限制或过滤。
参考文档:选项和参数(traceroute --help)
英文
root@ubuntu:~# traceroute --helpUsage: traceroute [ -46dFITnreAUDV ] [ -f first_ttl ] [ -g gate,... ] [ -i device ] [ -m max_ttl ] [ -N squeries ] [ -p port ] [ -t tos ] [ -l flow_label ] [ -w MAX,HERE,NEAR ] [ -q nqueries ] [ -s src_addr ] [ -z sendwait ] [ --fwmark=num ] host [ packetlen ]Options: -4 Use IPv4 -6 Use IPv6 -d --debug Enable socket level debugging -F --dont-fragment Do not fragment packets -f first_ttl --first=first_ttl Start from the first_ttl hop (instead from 1) -g gate,... --gateway=gate,... Route packets through the specified gateway (maximum 8 for IPv4 and 127 for IPv6) -I --icmp Use ICMP ECHO for tracerouting -T --tcp Use TCP SYN for tracerouting (default port is 80) -i device --interface=device Specify a network interface to operate with -m max_ttl --max-hops=max_ttl Set the max number of hops (max TTL to be reached). Default is 30 -N squeries --sim-queries=squeries Set the number of probes to be tried simultaneously (default is 16) -n Do not resolve IP addresses to their domain names -p port --port=port Set the destination port to use. It is either initial udp port value for "default" method (incremented by each probe, default is 33434), or initial seq for "icmp" (incremented as well, default from 1), or some constant destination port for other methods (with default of 80 for "tcp", 53 for "udp", etc.) -t tos --tos=tos Set the TOS (IPv4 type of service) or TC (IPv6 traffic class) value for outgoing packets -l flow_label --flowlabel=flow_label Use specified flow_label for IPv6 packets -w MAX,HERE,NEAR --wait=MAX,HERE,NEAR Wait for a probe no more than HERE (default 3) times longer than a response from the same hop, or no more than NEAR (default 10) times than some next hop, or MAX (default 5.0) seconds (float point values allowed too) -q nqueries --queries=nqueries Set the number of probes per each hop. Default is 3 -r Bypass the normal routing and send directly to a host on an attached network -s src_addr --source=src_addr Use source src_addr for outgoing packets -z sendwait --sendwait=sendwait Minimal time interval between probes (default 0). If the value is more than 10, then it specifies a number in milliseconds, else it is a number of seconds (float point values allowed too) -e --extensions Show ICMP extensions (if present), including MPLS -A --as-path-lookups Perform AS path lookups in routing registries and print results directly after the corresponding addresses -M name --module=name Use specified module (either builtin or external) for traceroute operations. Most methods have their shortcuts (`-I' means `-M icmp' etc.) -O OPTS,... --options=OPTS,... Use module-specific option OPTS for the traceroute module. Several OPTS allowed, separated by comma. If OPTS is "help", print info about available options --sport=num Use source port num for outgoing packets. Implies `-N 1' --fwmark=num Set firewall mark for outgoing packets -U --udp Use UDP to particular port for tracerouting (instead of increasing the port per each probe), default port is 53 -UL Use UDPLITE for tracerouting (default dest port is 53) -D --dccp Use DCCP Request for tracerouting (default port is 33434) -P prot --protocol=prot Use raw packet of protocol prot for tracerouting --mtu Discover MTU along the path being traced. Implies `-F -N 1' --back Guess the number of hops in the backward path and print if it differs -V --version Print version info and exit --help Read this help and exitArguments:+ host The host to traceroute to packetlen The full packet length (default is the length of an IP header plus 40). Can be ignored or increased to a minimal allowed value
中文
root@ubuntu:~# traceroute --help使用方法: traceroute [ -46dFITnreAUDV ] [ -f first_ttl ] [ -g gate,... ] [ -i device ] [ -m max_ttl ] [ -N squeries ] [ -p port ] [ -t tos ] [ -l flow_label ] [ -w MAX,HERE,NEAR ] [ -q nqueries ] [ -s src_addr ] [ -z sendwait ] [ --fwmark=num ] host [ packetlen ]选项: -4 使用 IPv4 -6 使用 IPv6 -d --debug 启用套接字级别调试 -F --dont-fragment 不对数据包进行分片 -f first_ttl --first=first_ttl 从 first_ttl 跳数开始(而不是从 1 开始) -g gate,... --gateway=gate,... 通过指定的网关路由数据包 (IPv4最多8个,IPv6最多127个) -I --icmp 使用 ICMP ECHO 进行路径跟踪 -T --tcp 使用 TCP SYN 进行路径跟踪(默认端口为 80) -i device --interface=device 指定要操作的网络接口 -m max_ttl --max-hops=max_ttl 设置跳数上限(到达的最大TTL)。默认为30 -N squeries --sim-queries=squeries 设置同时尝试的探测数量(默认为16) -n 不将 IP 地址解析为它们的域名 -p port --port=port 设置要使用的目标端口。它可以是 "default" 方法的初始 udp 端口值 (每次探测递增,默认为33434),或者 "icmp" 的初始序列号 (同样递增,默认从1开始),或者其他方法的某些固定目标端口 ("tcp" 默认为80,"udp" 默认为53等) -t tos --tos=tos 为出站数据包设置 TOS(IPv4服务类型)或 TC(IPv6 流量类别)值 -l flow_label --flowlabel=flow_label 对于 IPv6 数据包使用指定的 flow_label -w MAX,HERE,NEAR --wait=MAX,HERE,NEAR 对于一个探针,最多等待 HERE(默认3)倍于来自同一跳的响应时间, 或者最多 NEAR(默认10)倍于某个下一跳的时间,或者 MAX(默认5.0) 秒(也允许浮点数值) -q nqueries --queries=nqueries 设置每次跳数探测的探针数量。默认为 3 -r 绕过常规路由,直接发送到连接的网络上的 主机 -s src_addr --source=src_addr 使用源地址 src_addr 发送出站数据包 -z sendwait --sendwait=sendwait 探测之间的最小时间间隔(默认为0)。 如果该值超过10,则指定为 毫秒数,否则是秒数(也允许浮点数值) -e --extensions 显示 ICMP 扩展(如果存在),包括 MPLS -A --as-path-lookups 在路由注册表中执行 AS 路径查找,并在对应的 地址后直接打印结果 -M name --module=name 使用指定模块(内置或外部)进行 traceroute 操作。 大多数方法都有 它们的快捷方式(`-I' 表示 `-M icmp' 等) -O OPTS,... --options=OPTS,... 使用模块特定选项 OPTS 进行 traceroute 模块。允许多个 OPTS, 用逗号分隔。如果 OPTS 是 "help",打印信息 关于可用选项 --sport=num 使用源端口 num 发送出站数据包。意味着 `-N 1' --fwmark=num 为出站数据包设置防火墙标记 -U --udp 使用 UDP 到特定端口进行 tracerouting (而不是每次探测都增加端口), 默认端口为53 -UL 使用 UDPLITE 进行 tracerouting(默认目的端口 为53) -D --dccp 使用 DCCP 请求进行 tracerouting(默认端口 为33434) -P prot --protocol=prot 使用原始协议包 prot 进行 tracerouting --mtu 发现被追踪路径上的 MTU。意味着 `-F -N 1' --back 猜测反向路径的跳数并打印 如果与前向不同 -V --version 打印版本信息并退出 --help 阅读此帮助信息并退出参数:+ host 要 traceroute 到的主机 packetlen 整个数据包长度(默认为 IP 头部长度加 40)。 可以忽略或增加到最小 允许的值
示例与输出解读
traceroute -n google.com
输出示例:
traceroute to google.com (172.217.16.206), 30 hops max, 60 byte packets 1 192.168.1.1 1.123 ms 0.865 ms 0.635 ms 2 10.20.30.40 11.006 ms 10.668 ms 10.345 ms 3 12.34.56.78 15.002 ms 14.674 ms 14.348 ms ...14 172.217.16.206 25.123 ms 24.785 ms 24.463 ms
每行代表一个跳数,显示了该跳数上的路由器的 IP 地址和三次探测的往返时间。
疑难技术点解析
路由器不响应问题
并非所有的路由器都会对 traceroute 发送的数据包进行响应。一些路由器配置了防火墙或 ACLs(访问控制列表),可能不会返回 ICMP 时间超时消息。
* 表示的含义
在 traceroute 的输出中,如果某一跳显示为 *,则表示该跳没有响应。这可能是因为传输超时或丢包,也可能是路由器设置了不回复 ICMP 或 UDP 包。
最后一跳通常不显示
有时候,即使 traceroute 完成了,最后一跳也可能不显示目标主机。这可能是因为目标主机的防火墙设置阻止了 ICMP 或 UDP 响应。
实际案例演示
示例1
以下是一个实际的 traceroute 使用案例,用于诊断网络连接问题。
traceroute -n -q 1 -w 2 example.com
在这个例子中,-n 阻止了域名解析以便快速查看结果,-q 1 表示只发送一个查询包以简化输出,-w 2 设置了等待响应的超时时间为2秒。
输出可以帮助我们了解到哪里开始出现高延迟或者数据包丢失,进而进行针对性的网络故障排查。
20240529 示例2
上一篇: CentOS 升级 Glibc-2.28
下一篇: 【Linux实践室】Linux 查询命令帮助语句(文末送书)
本文标签
Linux traceroute命令原理及使用方法(显示数据包在到达指定目的地的过程中所经过的路径和每一跳的延迟)(跟踪路由跟踪)windows tracert命令(功能类似)
声明
本文内容仅代表作者观点,或转载于其他网站,本站不以此文作为商业用途
如有涉及侵权,请联系本站进行删除
转载本站原创文章,请注明来源及作者。