ECharts教程(详细)
一拖再拖 一拖再拖 2024-06-19 17:03:04 阅读 88
ECharts教程(详细)
非常全面的ECharts教程,非常全面的ECharts教程,目前线条/节点颜色、线条粗细、线条样式、线条阴影、线条平滑、线条节点大小、线条节点阴影、线条节点边框、线条节点边框阴影、工具提醒、工具提醒样式、工具自定义提醒、工具提醒背景、工具提醒边框、工具提醒阴影、工具提醒文字样式、工具箱、工具箱图标、工具箱标题、工具箱功能、类别显示、类别显示位置、类别显示图标、类别显示图标大小、类别显示图标间距、类别显示、类别显示位置、类别显示图标、类别显示图标大小、类别显示图标间距、类别显示图标文字大小、类别显示图标文字颜色、轴方向等多达四十个快捷键使多达四十个快捷键使用。
可以在使用过程中轻松应对大部分场景。由于时间原因,本文只更新全文的10%。以下时间会持续更新,ECharts 是一个常用的工具,但苦涩的 API 常常让人困惑。建议收藏一份,以方便使用时快速查找和解决问题。
这些内容需要一定的echarts理解基础知识。可以访问https://echarts.apache.org/examples/zh/editor.html?c=line-simple 按照教程在线学习。
文章目录
ECharts教程(详细)1:线条/节点颜色2:线条粗细3:线条样式4:线条阴影5:线条平滑6:线条节点大小7:线条节点阴影8:线条节点边框9:线条节点边框阴影10:工具提醒11:工具提醒样式12:工具自定义提醒13:工具提醒背景14:工具提醒边框15:工具提醒阴影16:工具提醒文字样式17:工具箱18:工具箱图标19:工具箱标题20:工具箱功能21:类别显示22:类别显示位置23:类别显示图标24:类别显示图标大小25:类别显示图标间距26:类别显示图标文字大小27:类别显示图标文字颜色28:轴方向(同其他,如柱状图等)29:坐标轴名称30:坐标轴名称位置31:坐标轴名称文字样式32:坐标轴名称与轴线之间的距离33:显示标签34:标签位置35:标签文字样式36:标签背景色37:标签边框38:标签边框圆角39:标签内边距40:标签阴影41:标签旋转42:x轴内容偏移43:x轴内容样式44:持续更新中 ......
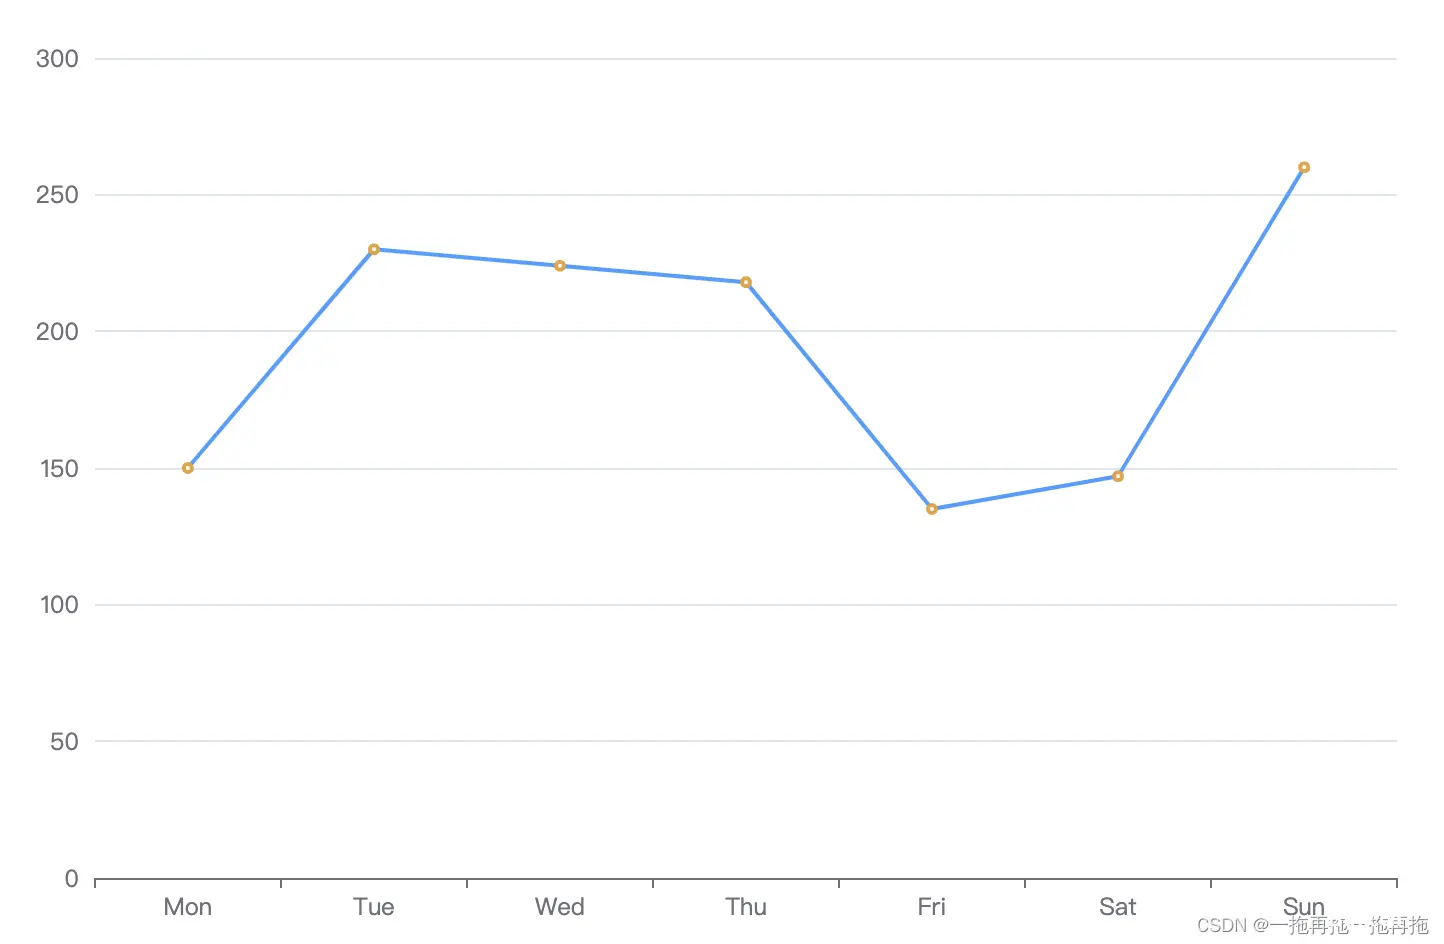
1:线条/节点颜色
series: [ { data: [150, 230, 224, 218, 135, 147, 260], type: 'line', itemStyle: { normal: { color: '#E6A23C', lineStyle: { color: '#409EFF' } } }, }]
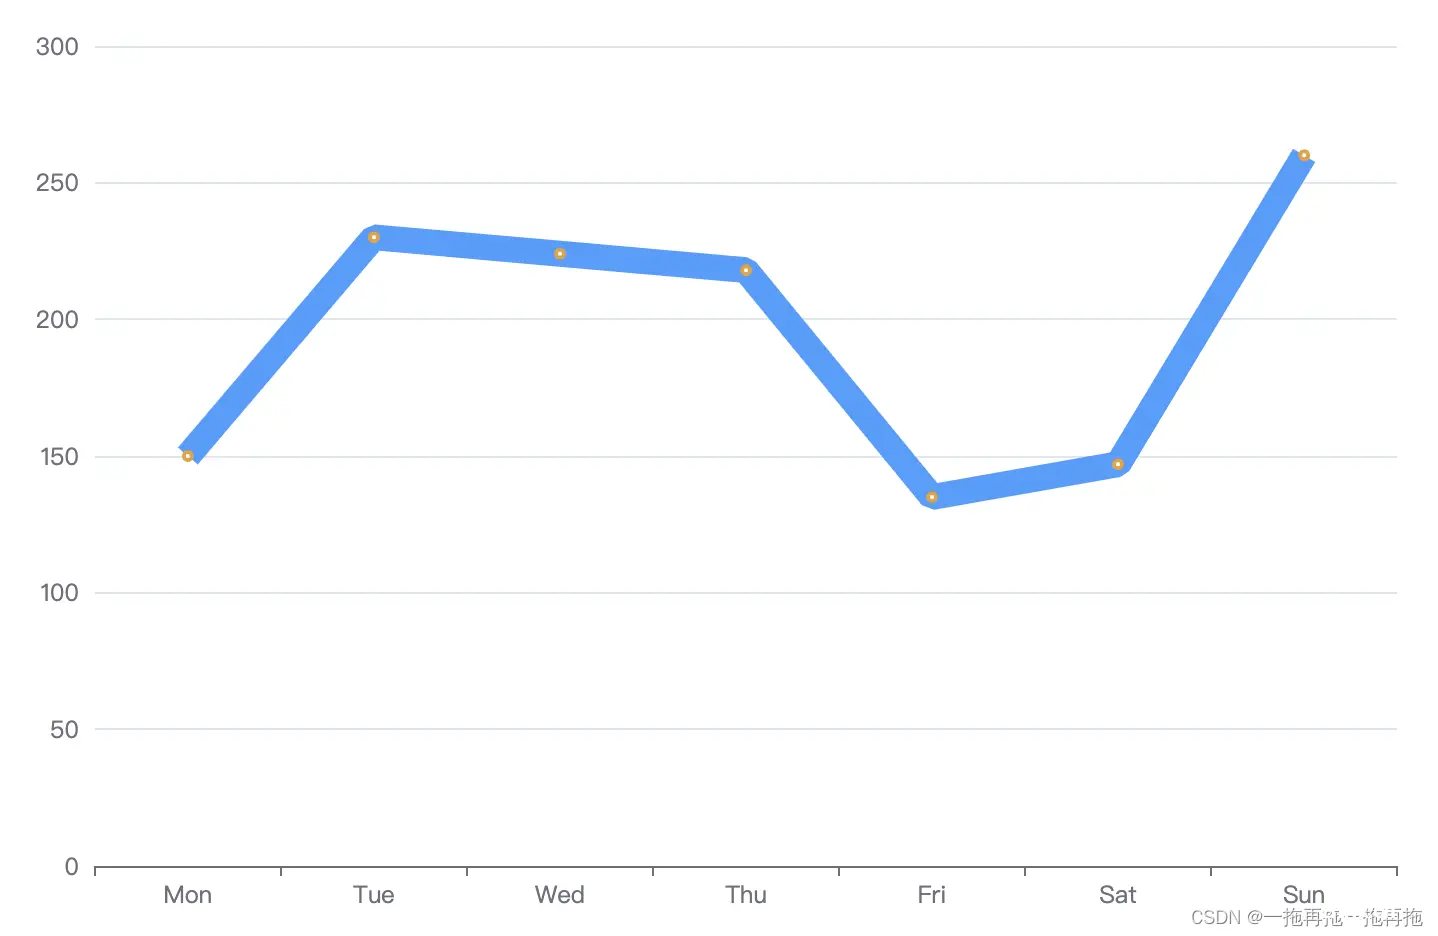
2:线条粗细
series: [ { data: [150, 230, 224, 218, 135, 147, 260], type: 'line', itemStyle: { normal: { color: '#E6A23C', lineStyle: { color: '#409EFF', width: 3 } } }, }]
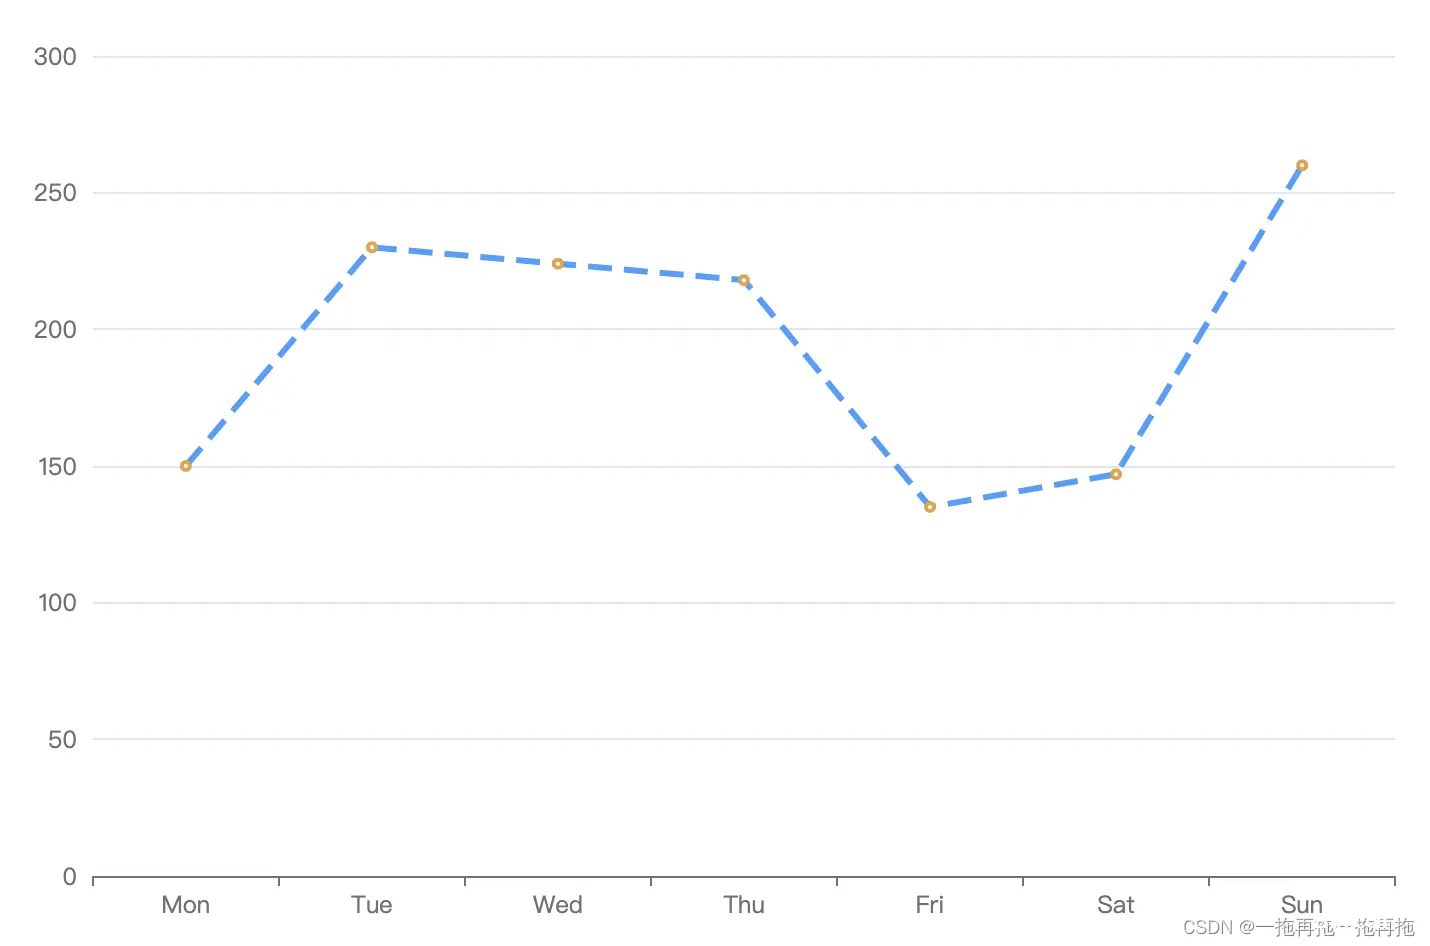
3:线条样式
series: [ { data: [150, 230, 224, 218, 135, 147, 260], type: 'line', itemStyle: { normal: { color: '#E6A23C', lineStyle: { color: '#409EFF', width: 3, type: 'dashed' } } }, }]
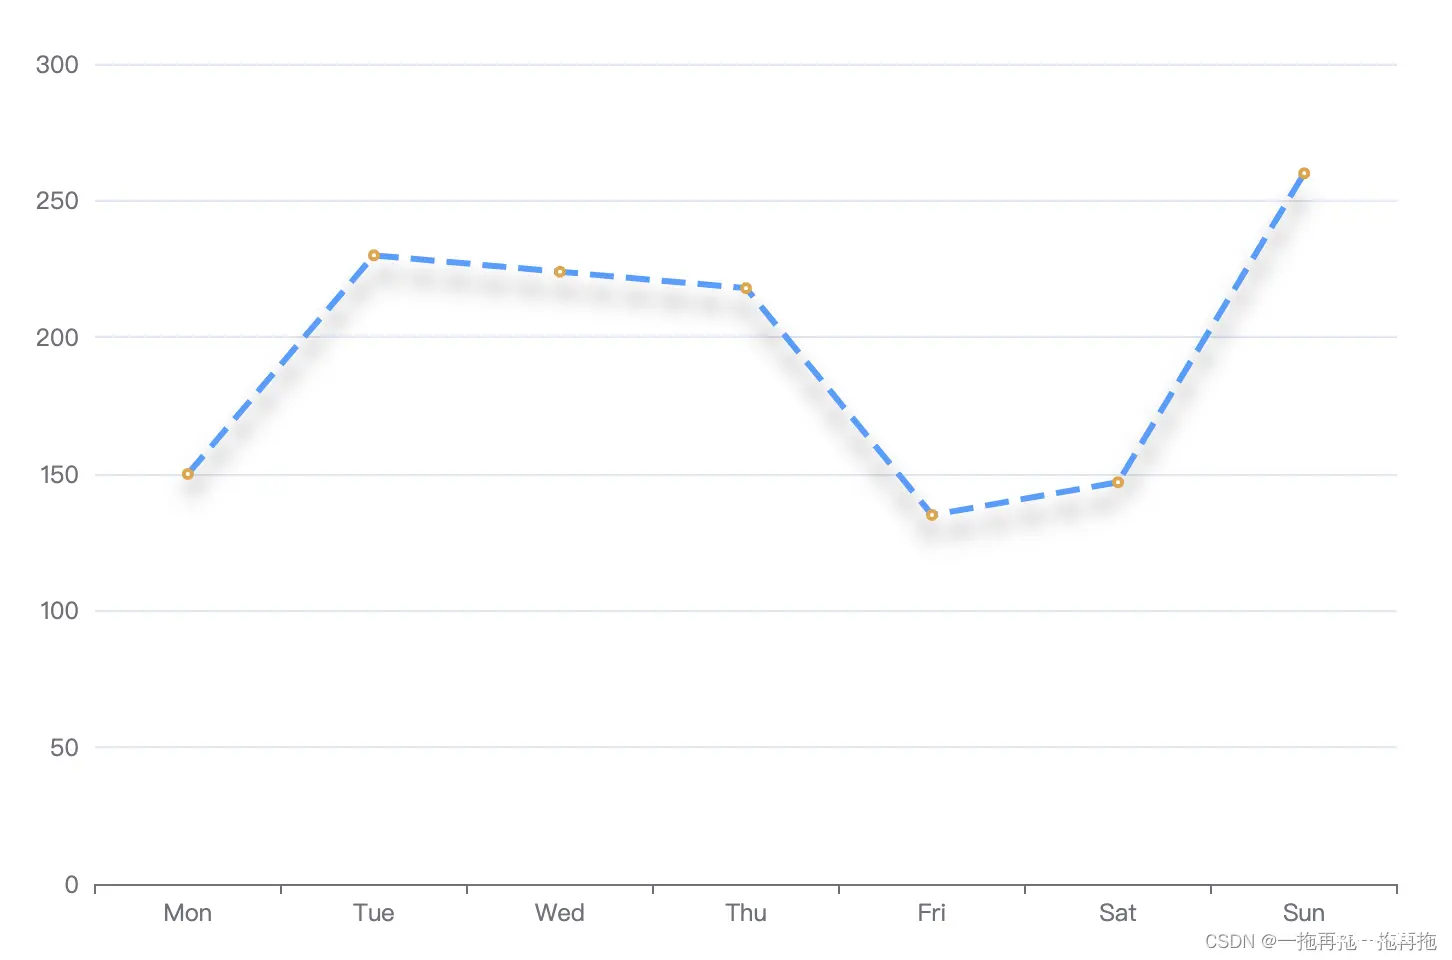
4:线条阴影
series: [ { data: [150, 230, 224, 218, 135, 147, 260], type: 'line', itemStyle: { normal: { color: '#E6A23C', lineStyle: { color: '#409EFF', width: 3, type: 'dashed', shadowColor: 'rgba(0, 0, 0, 0.5)', shadowBlur: 10, shadowOffsetY: 10 } } }, }]
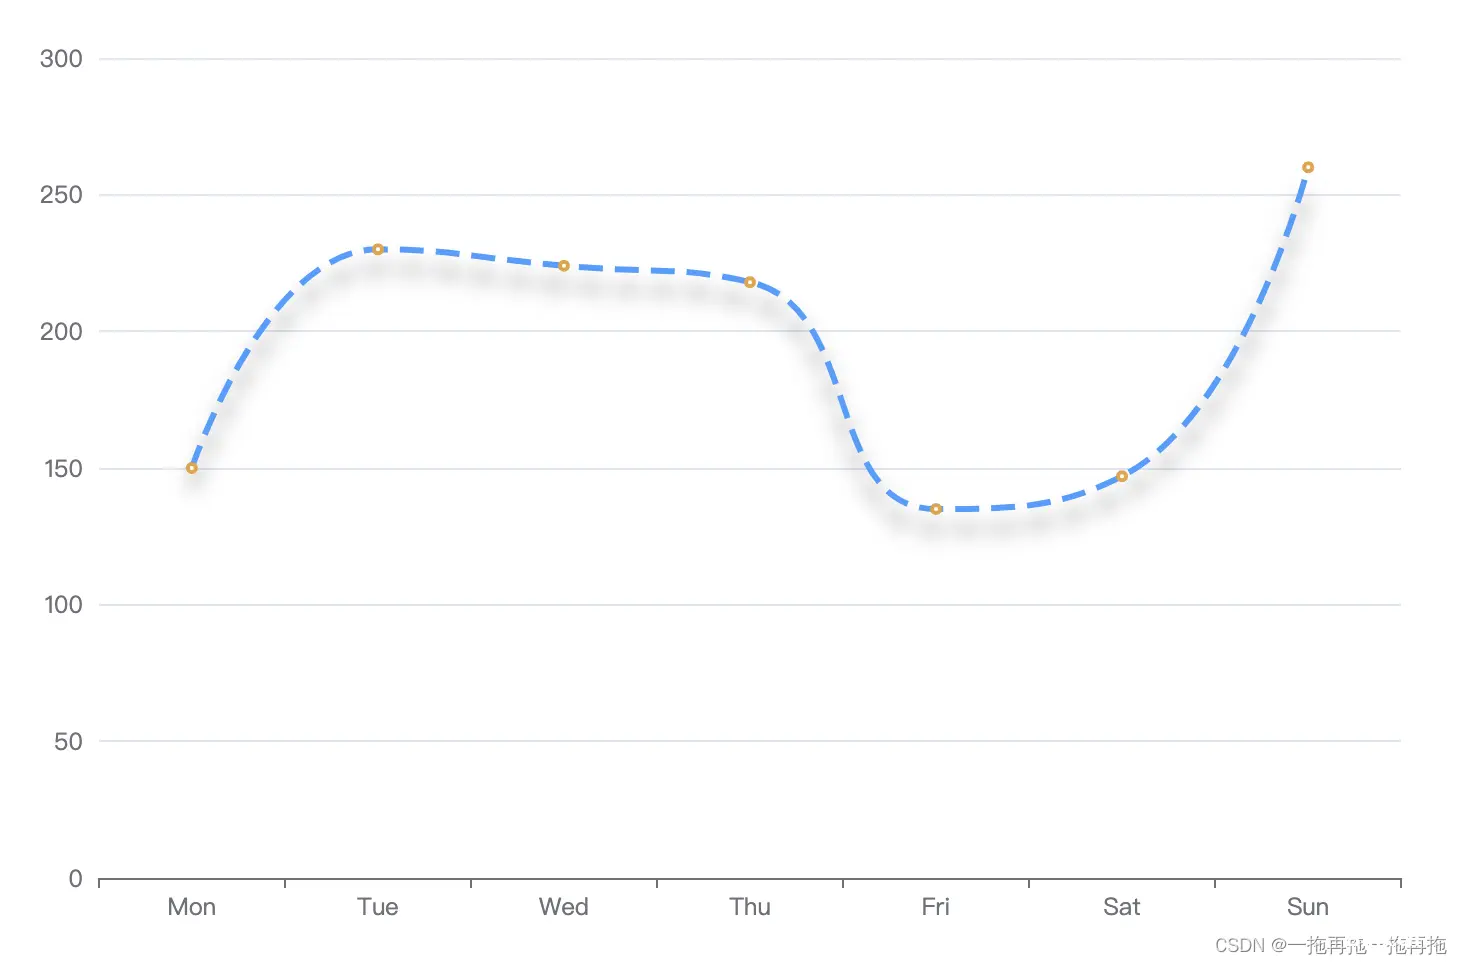
5:线条平滑
series: [ { data: [150, 230, 224, 218, 135, 147, 260], type: 'line', smooth: true, itemStyle: { normal: { color: '#E6A23C', lineStyle: { color: '#409EFF', width: 3, type: 'dashed', shadowColor: 'rgba(0, 0, 0, 0.5)', shadowBlur: 10, shadowOffsetY: 10 } } }, }]
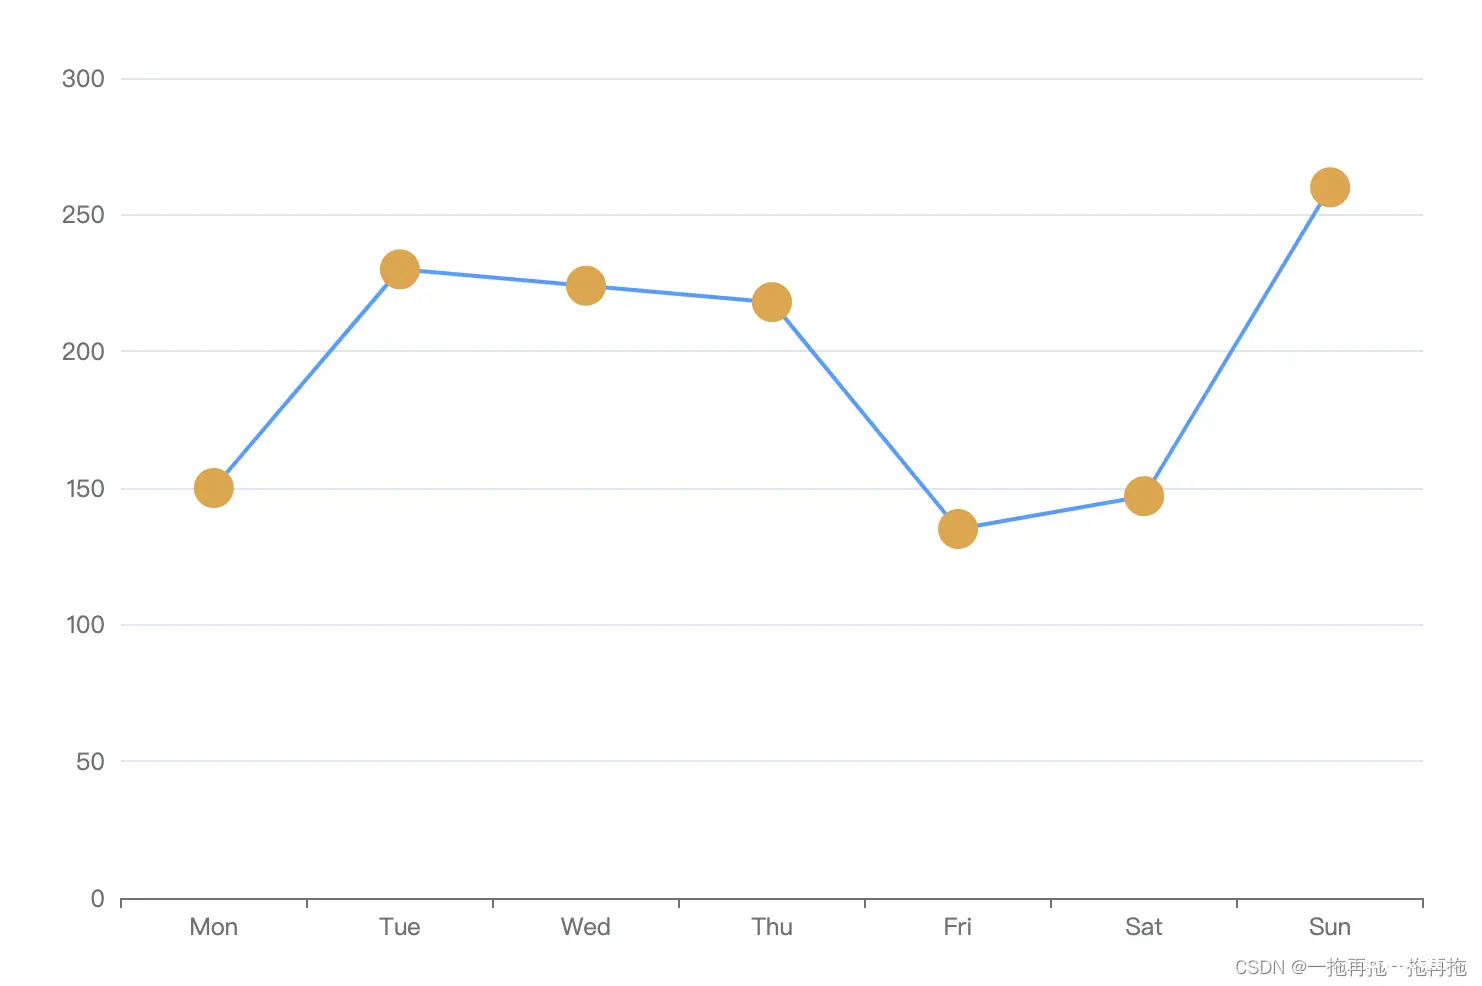
6:线条节点大小
series: [ { data: [150, 230, 224, 218, 135, 147, 260], type: 'line', symbol: 'circle', symbolSize: 20, itemStyle: { normal: { color: '#E6A23C', lineStyle: { color: '#409EFF', } } }, }]
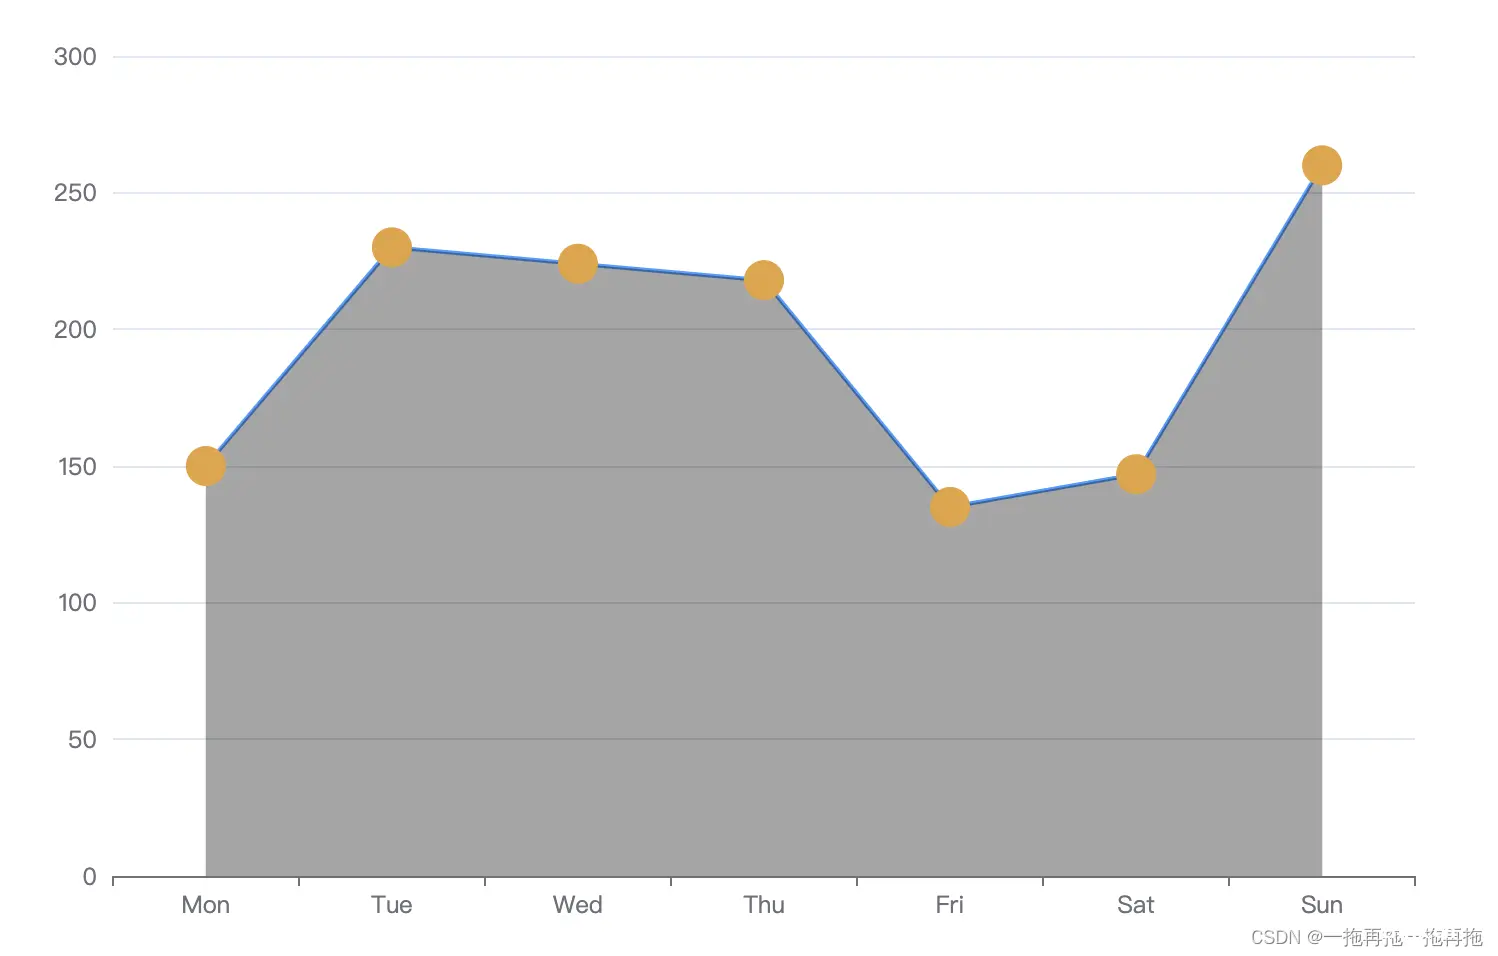
7:线条节点阴影
series: [ { data: [150, 230, 224, 218, 135, 147, 260], type: 'line', symbol: 'circle', symbolSize: 20, itemStyle: { normal: { color: '#E6A23C', lineStyle: { color: '#409EFF', }, areaStyle: { color: 'rgba(0, 0, 0, 0.5)' } } }, }]
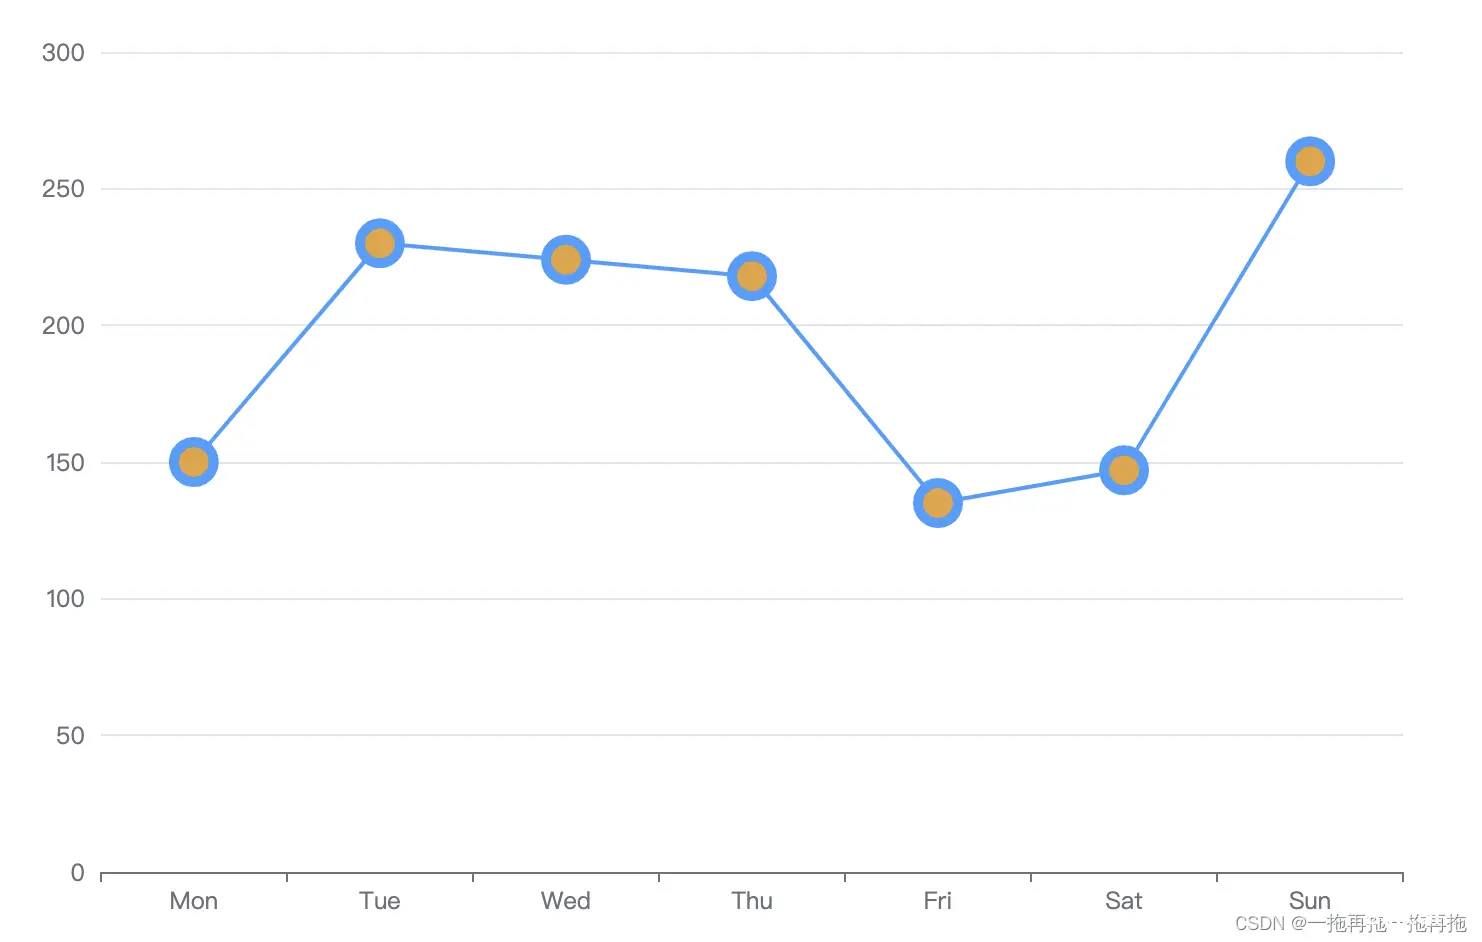
8:线条节点边框
series: [ { data: [150, 230, 224, 218, 135, 147, 260], type: 'line', symbol: 'circle', symbolSize: 20, itemStyle: { normal: { color: '#E6A23C', lineStyle: { color: '#409EFF', }, borderColor: '#409EFF', borderWidth: 5 } }, }]
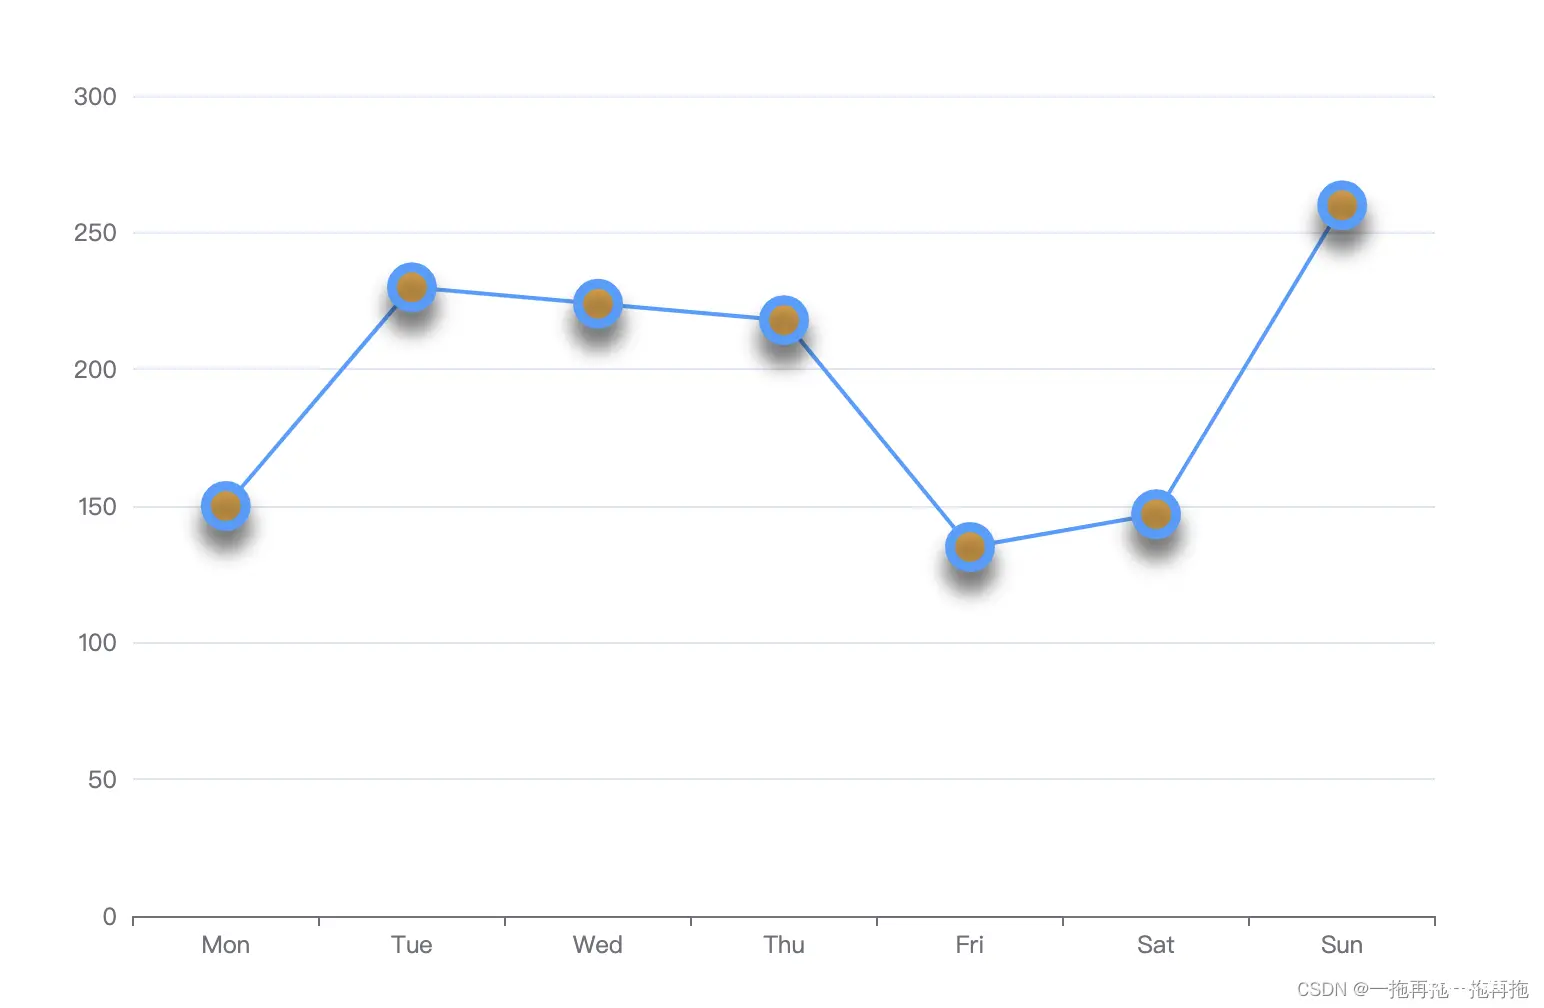
9:线条节点边框阴影
series: [ { data: [150, 230, 224, 218, 135, 147, 260], type: 'line', symbol: 'circle', symbolSize: 20, itemStyle: { normal: { color: '#E6A23C', lineStyle: { color: '#409EFF', }, borderColor: '#409EFF', borderWidth: 5, shadowColor: 'rgba(0, 0, 0, 0.5)', shadowBlur: 10, shadowOffsetY: 10 } }, }]
10:工具提醒
series: [ { data: [150, 230, 224, 218, 135, 147, 260], type: 'line', itemStyle: { normal: { color: '#E6A23C', lineStyle: { color: '#409EFF', }, } }, tooltip: { trigger: 'axis' }, }]
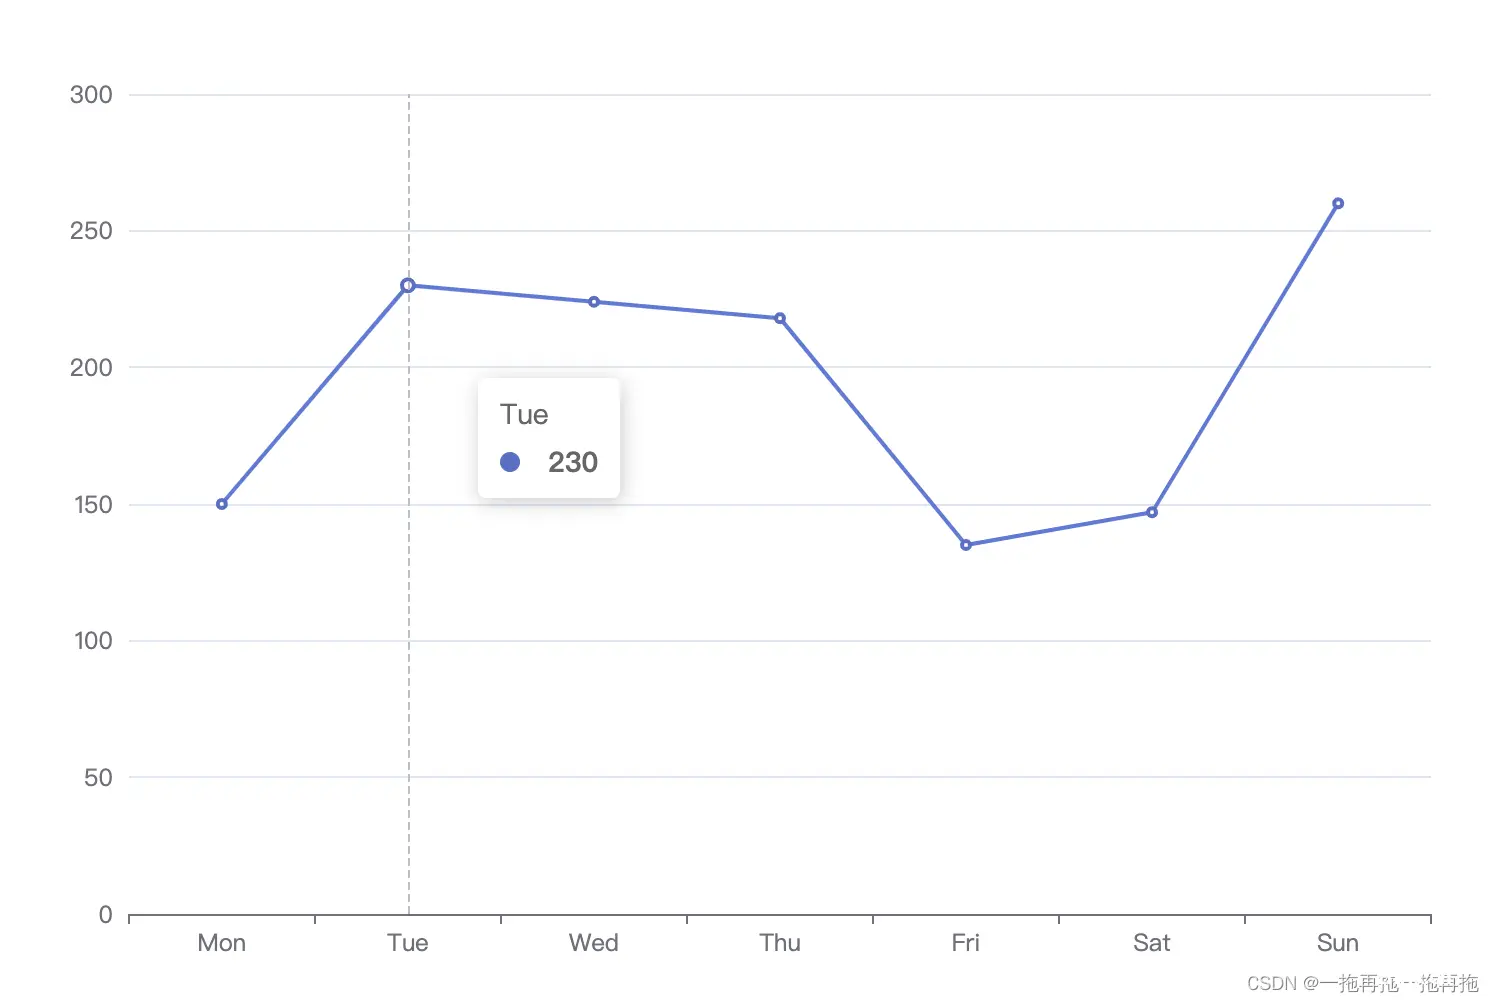
11:工具提醒样式
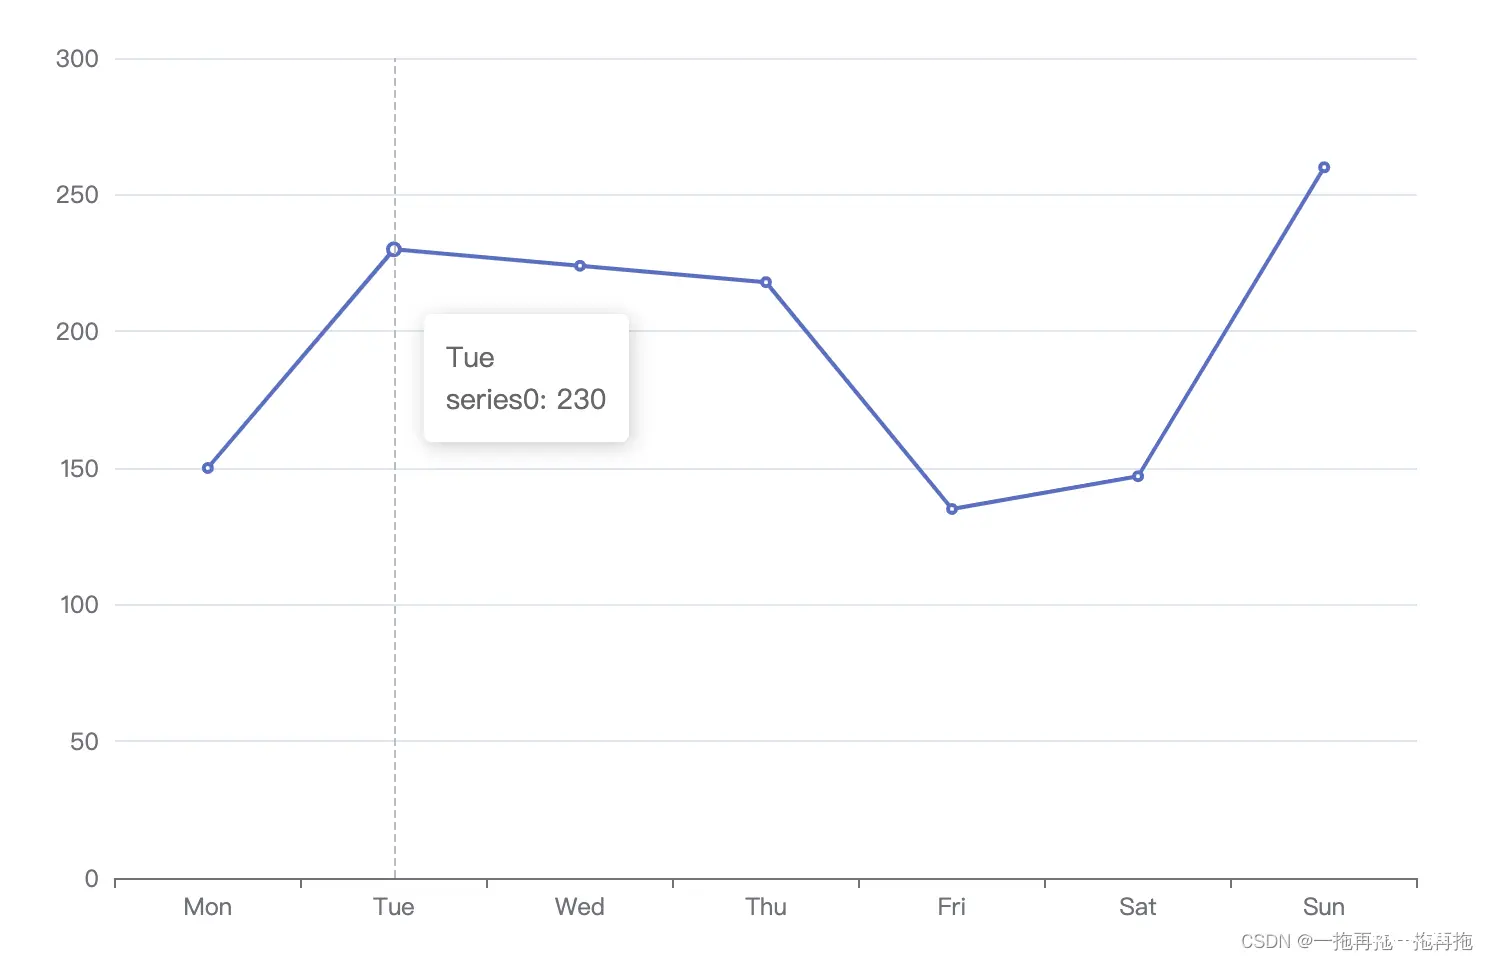
series: [ { data: [150, 230, 224, 218, 135, 147, 260], type: 'line', itemStyle: { normal: { color: '#E6A23C', lineStyle: { color: '#409EFF', }, } }, tooltip: { trigger: 'axis', formatter: '{b}<br />{a}: {c}' }, }]
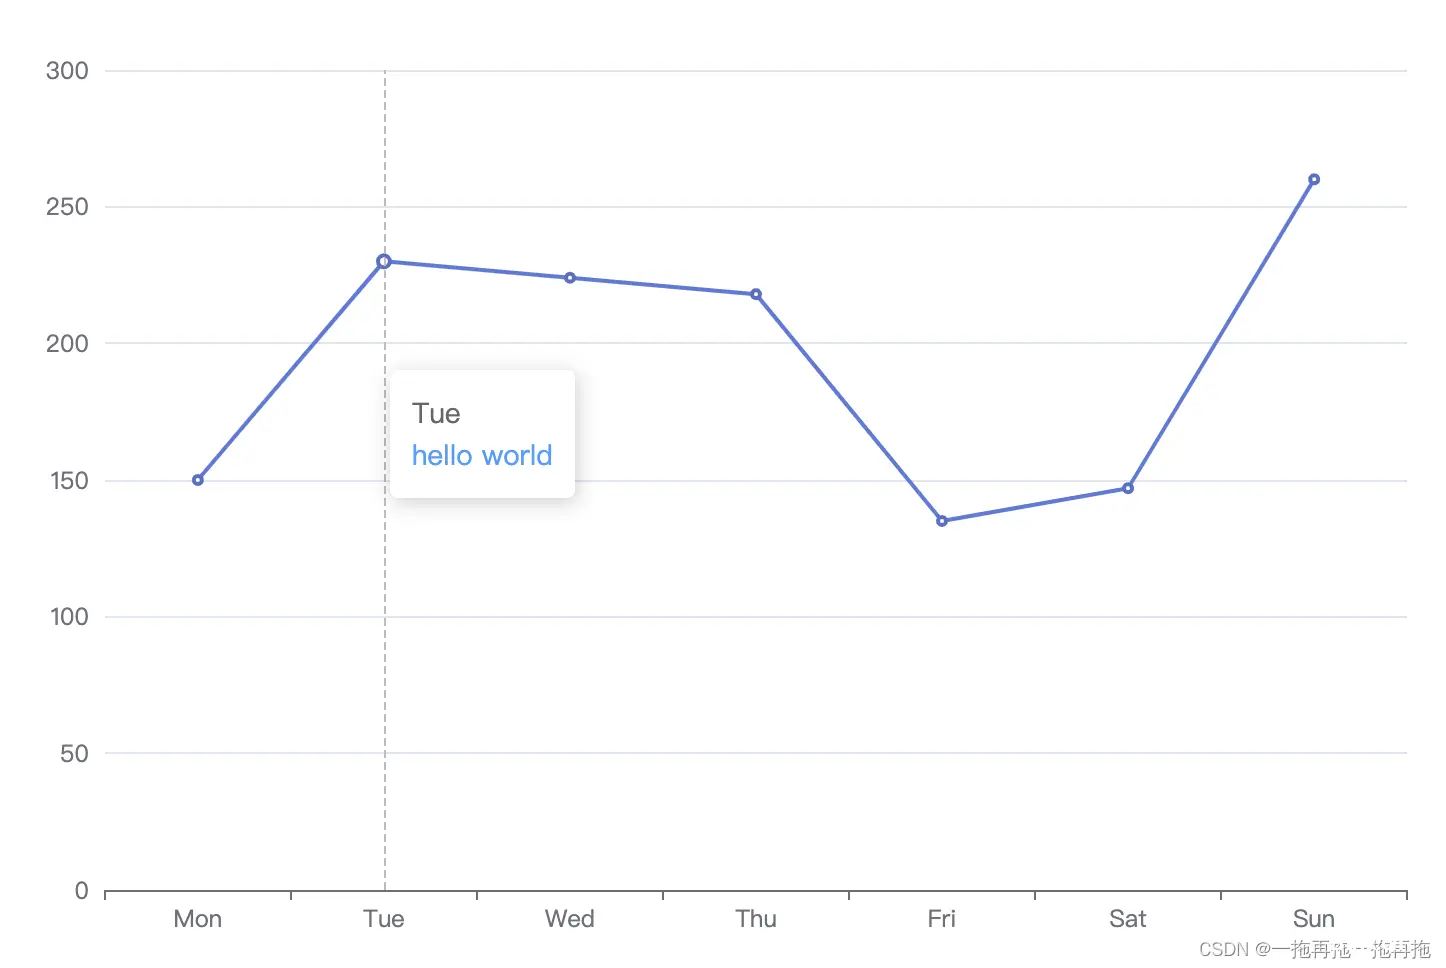
12:工具自定义提醒
series: [ { data: [150, 230, 224, 218, 135, 147, 260], type: 'line', itemStyle: { normal: { color: '#E6A23C', lineStyle: { color: '#409EFF', }, } }, tooltip: { trigger: 'axis', formatter: function (params) { return params[0].name + '<br /><span style="color:#409EFF">hello world<span>' } }, }]
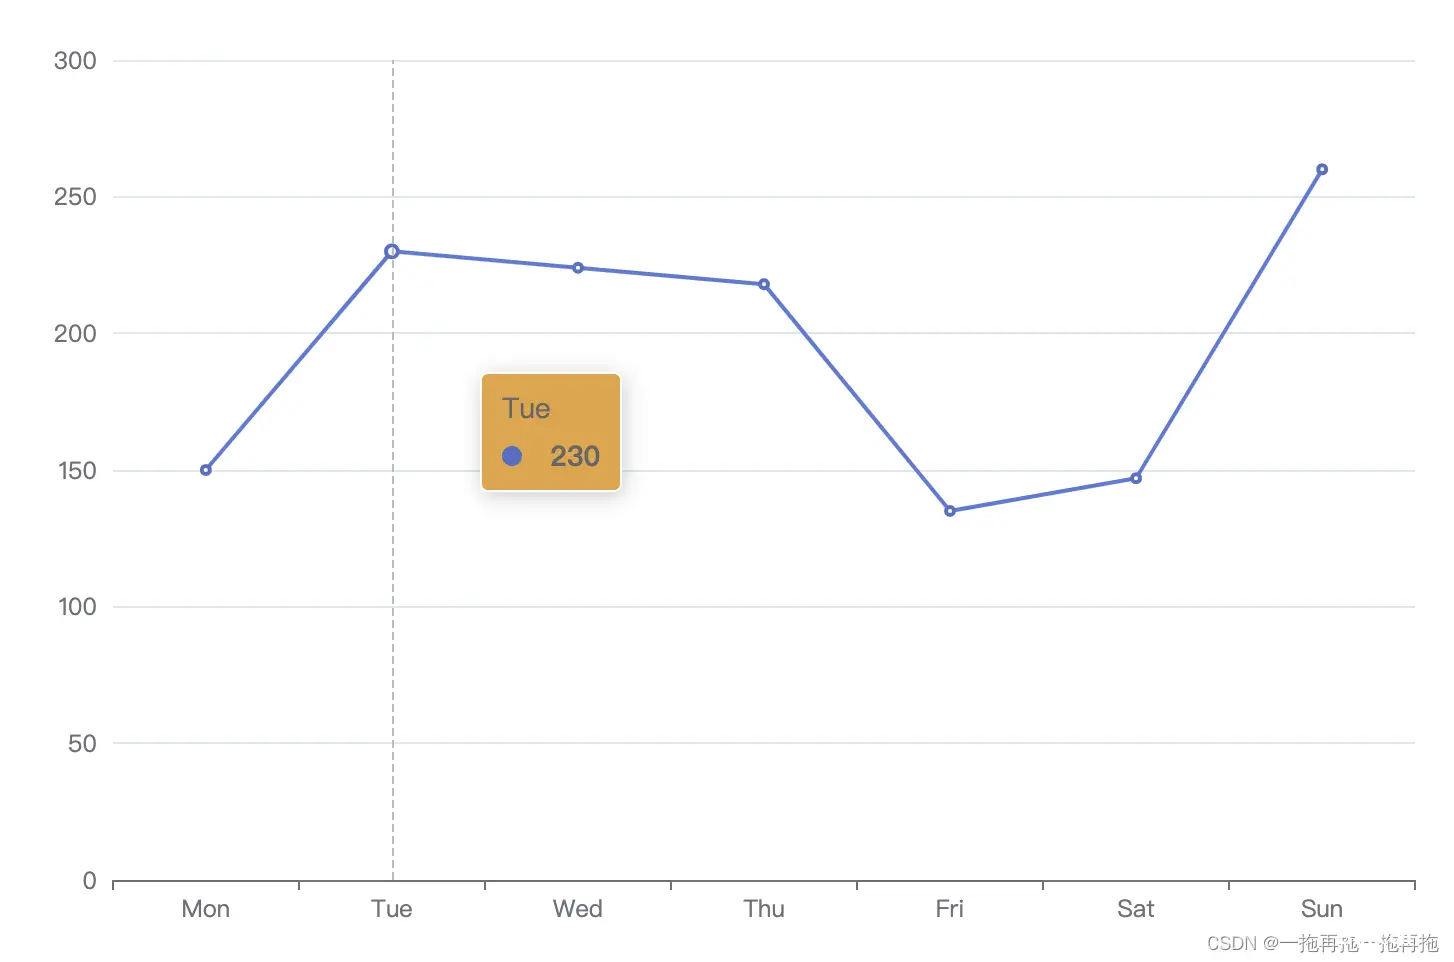
13:工具提醒背景
series: [ { data: [150, 230, 224, 218, 135, 147, 260], type: 'line', itemStyle: { normal: { color: '#E6A23C', lineStyle: { color: '#409EFF', }, } }, tooltip: { trigger: 'axis', backgroundColor: '#E6A23C' }, }]
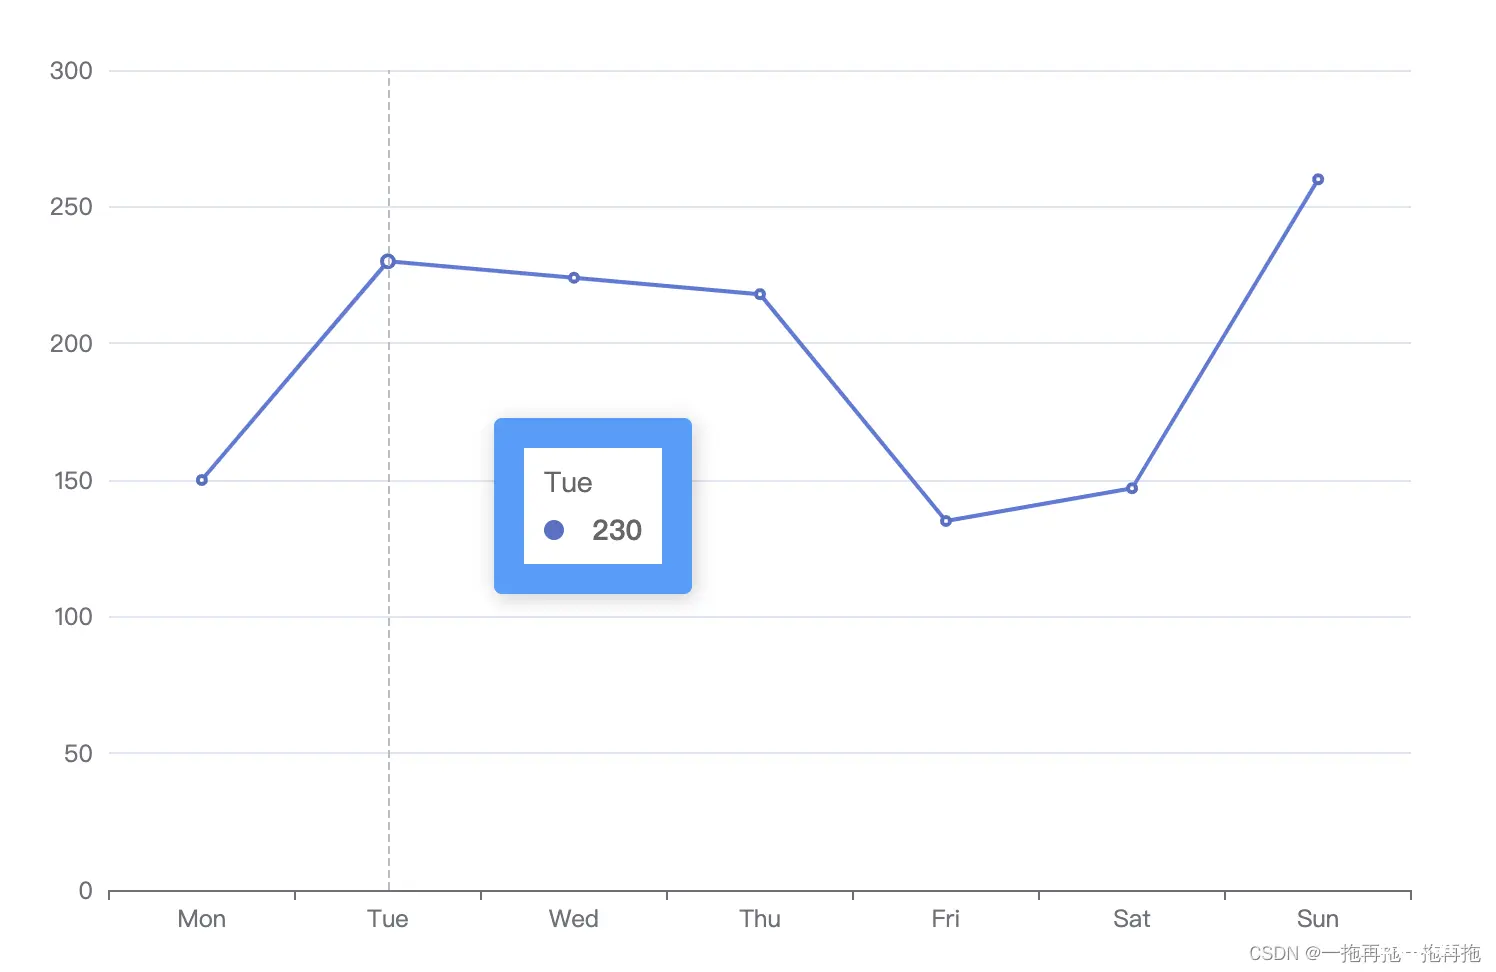
14:工具提醒边框
series: [ { data: [150, 230, 224, 218, 135, 147, 260], type: 'line', itemStyle: { normal: { color: '#E6A23C', lineStyle: { color: '#409EFF', }, } }, tooltip: { trigger: 'axis', borderColor: '#409EFF', borderWidth: 15 }, }]
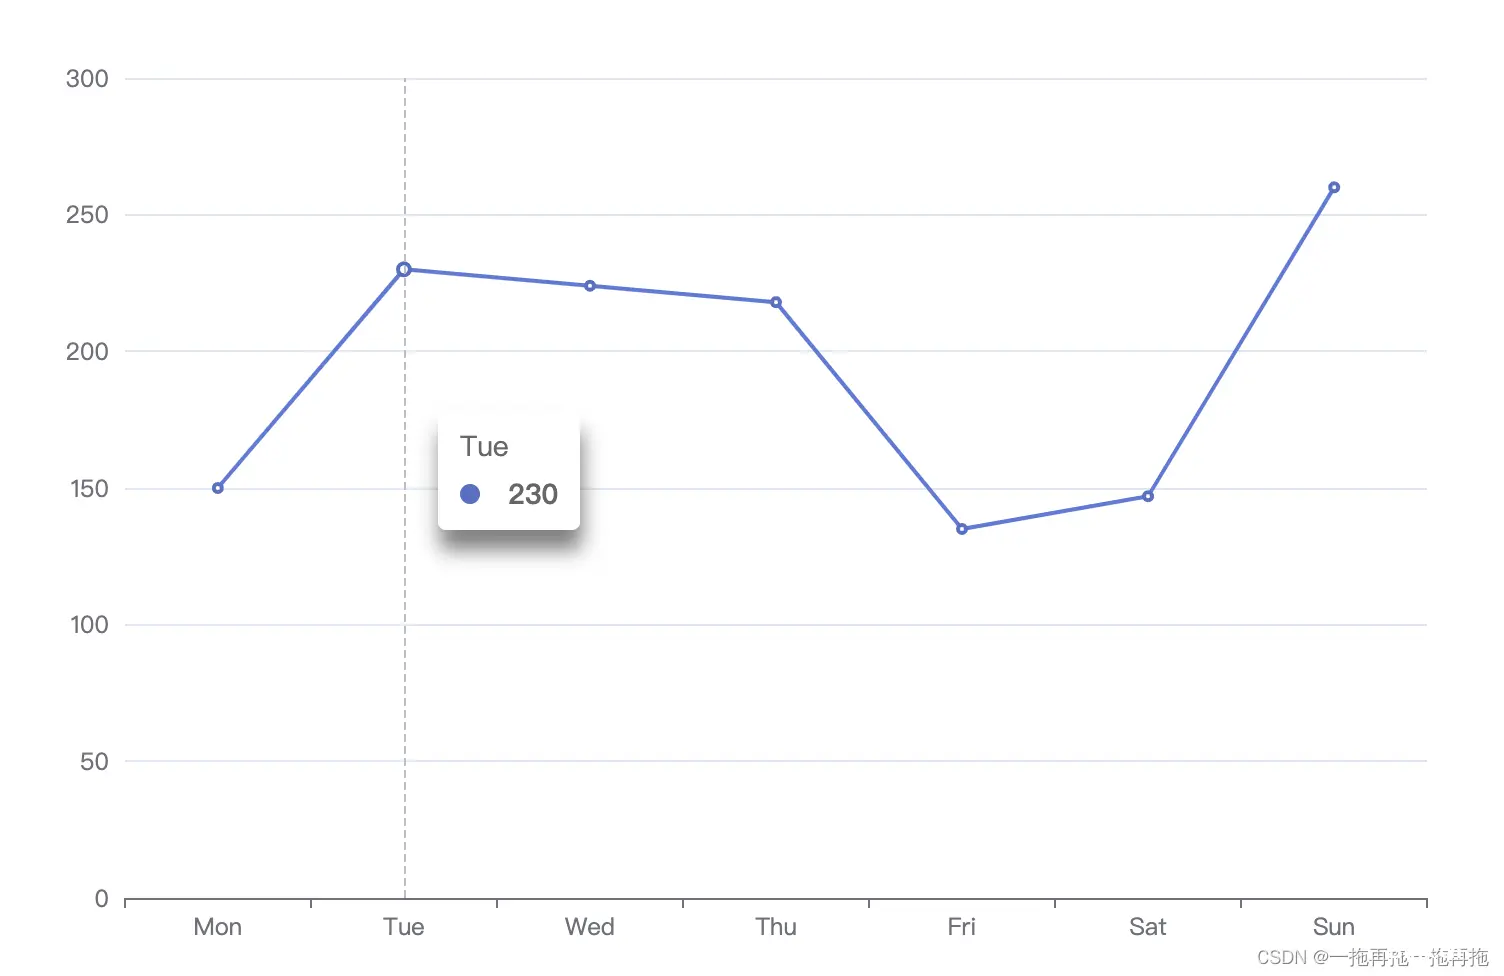
15:工具提醒阴影
series: [ { data: [150, 230, 224, 218, 135, 147, 260], type: 'line', itemStyle: { normal: { color: '#E6A23C', lineStyle: { color: '#409EFF', }, } }, tooltip: { trigger: 'axis', shadowColor: 'rgba(0, 0, 0, 0.5)', shadowBlur: 10, shadowOffsetY: 10 }, }]
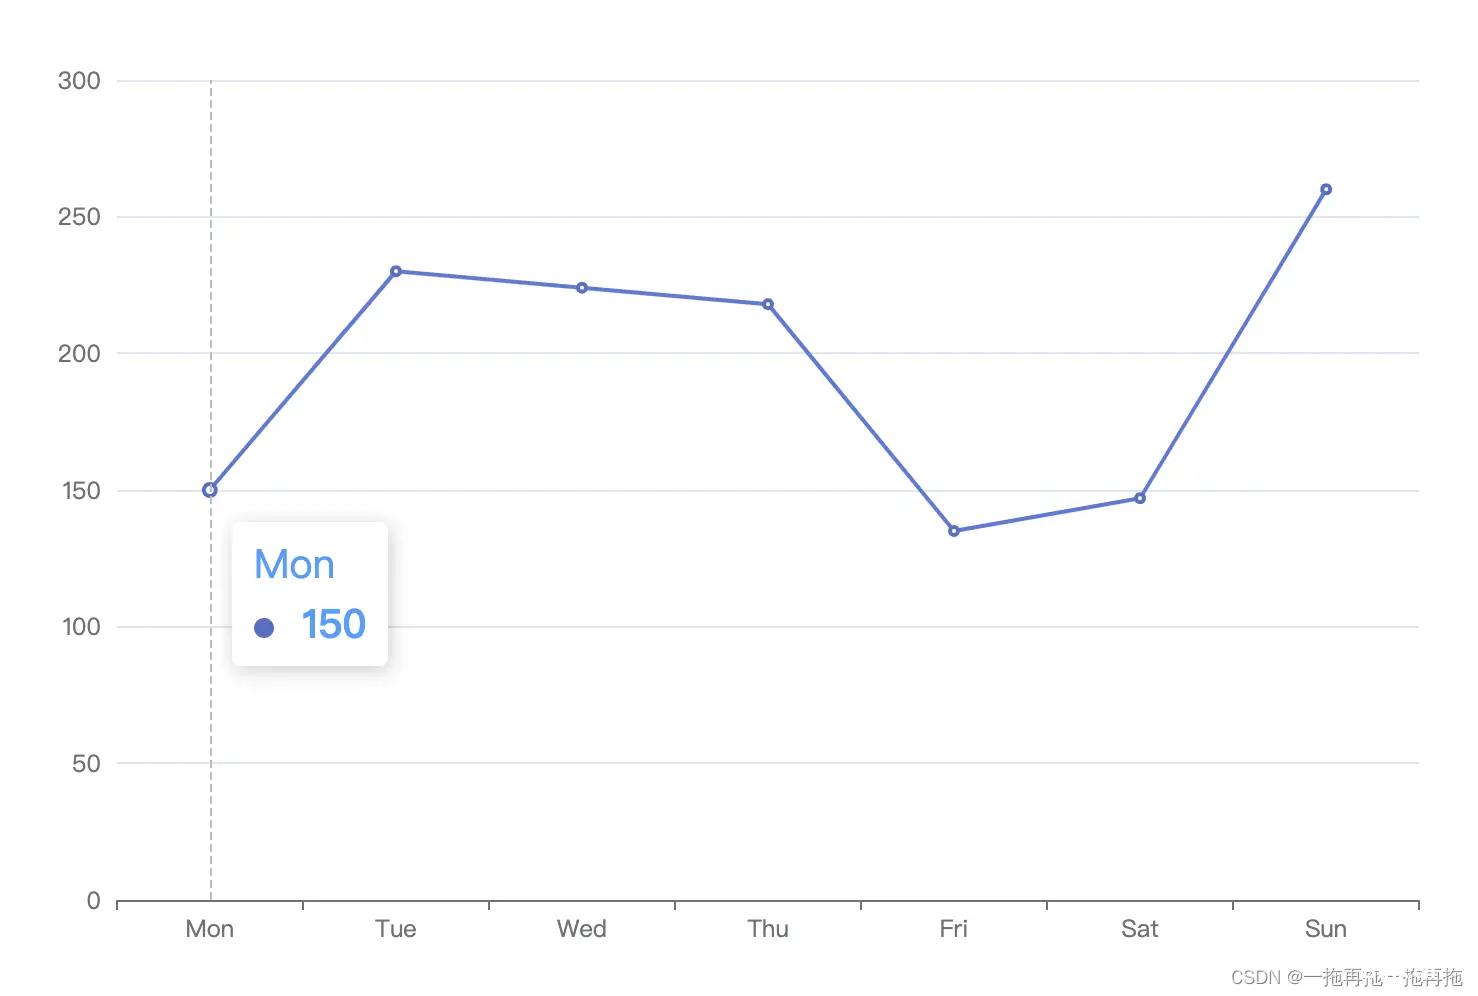
16:工具提醒文字样式
series: [ { data: [150, 230, 224, 218, 135, 147, 260], type: 'line', itemStyle: { normal: { color: '#E6A23C', lineStyle: { color: '#409EFF', }, } }, tooltip: { trigger: 'axis', textStyle: { color: '#409EFF', fontSize: 20 } }, }]
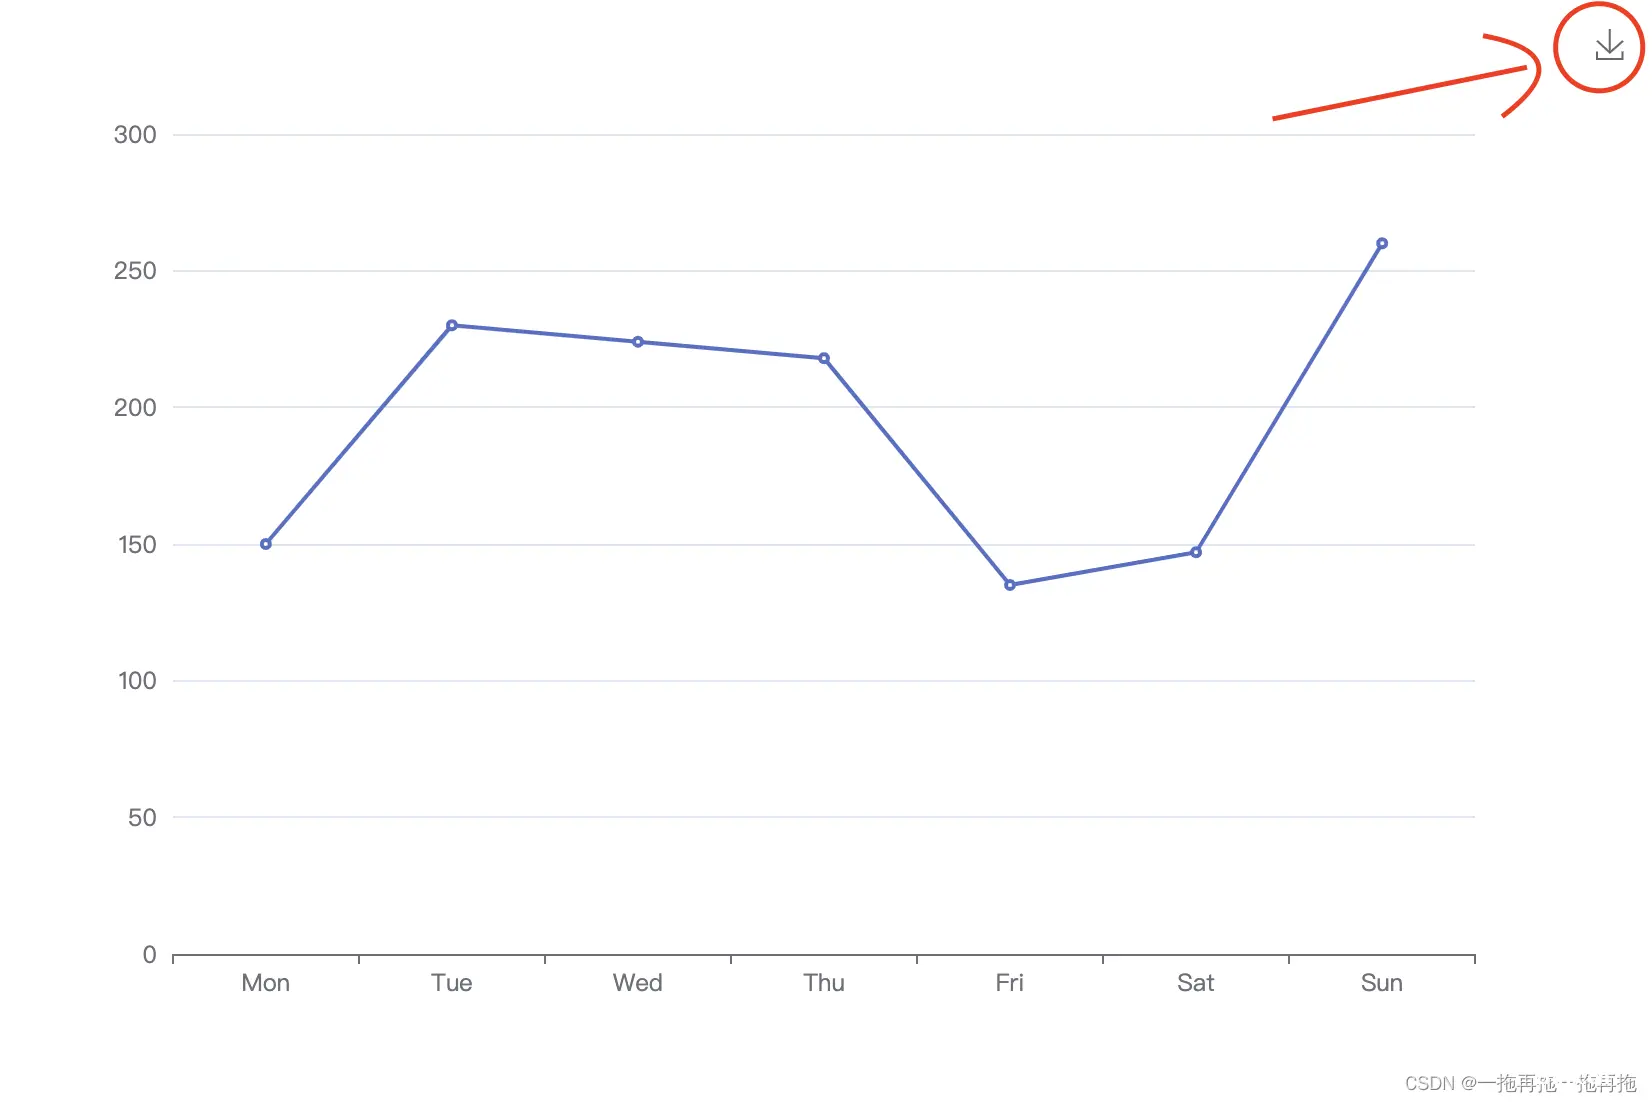
17:工具箱
option = { xAxis: { type: 'category', data: ['Mon', 'Tue', 'Wed', 'Thu', 'Fri', 'Sat', 'Sun'] }, yAxis: { type: 'value' }, toolbox: { feature: { saveAsImage: { } } }, series: [ { data: [150, 230, 224, 218, 135, 147, 260], type: 'line' } ]};
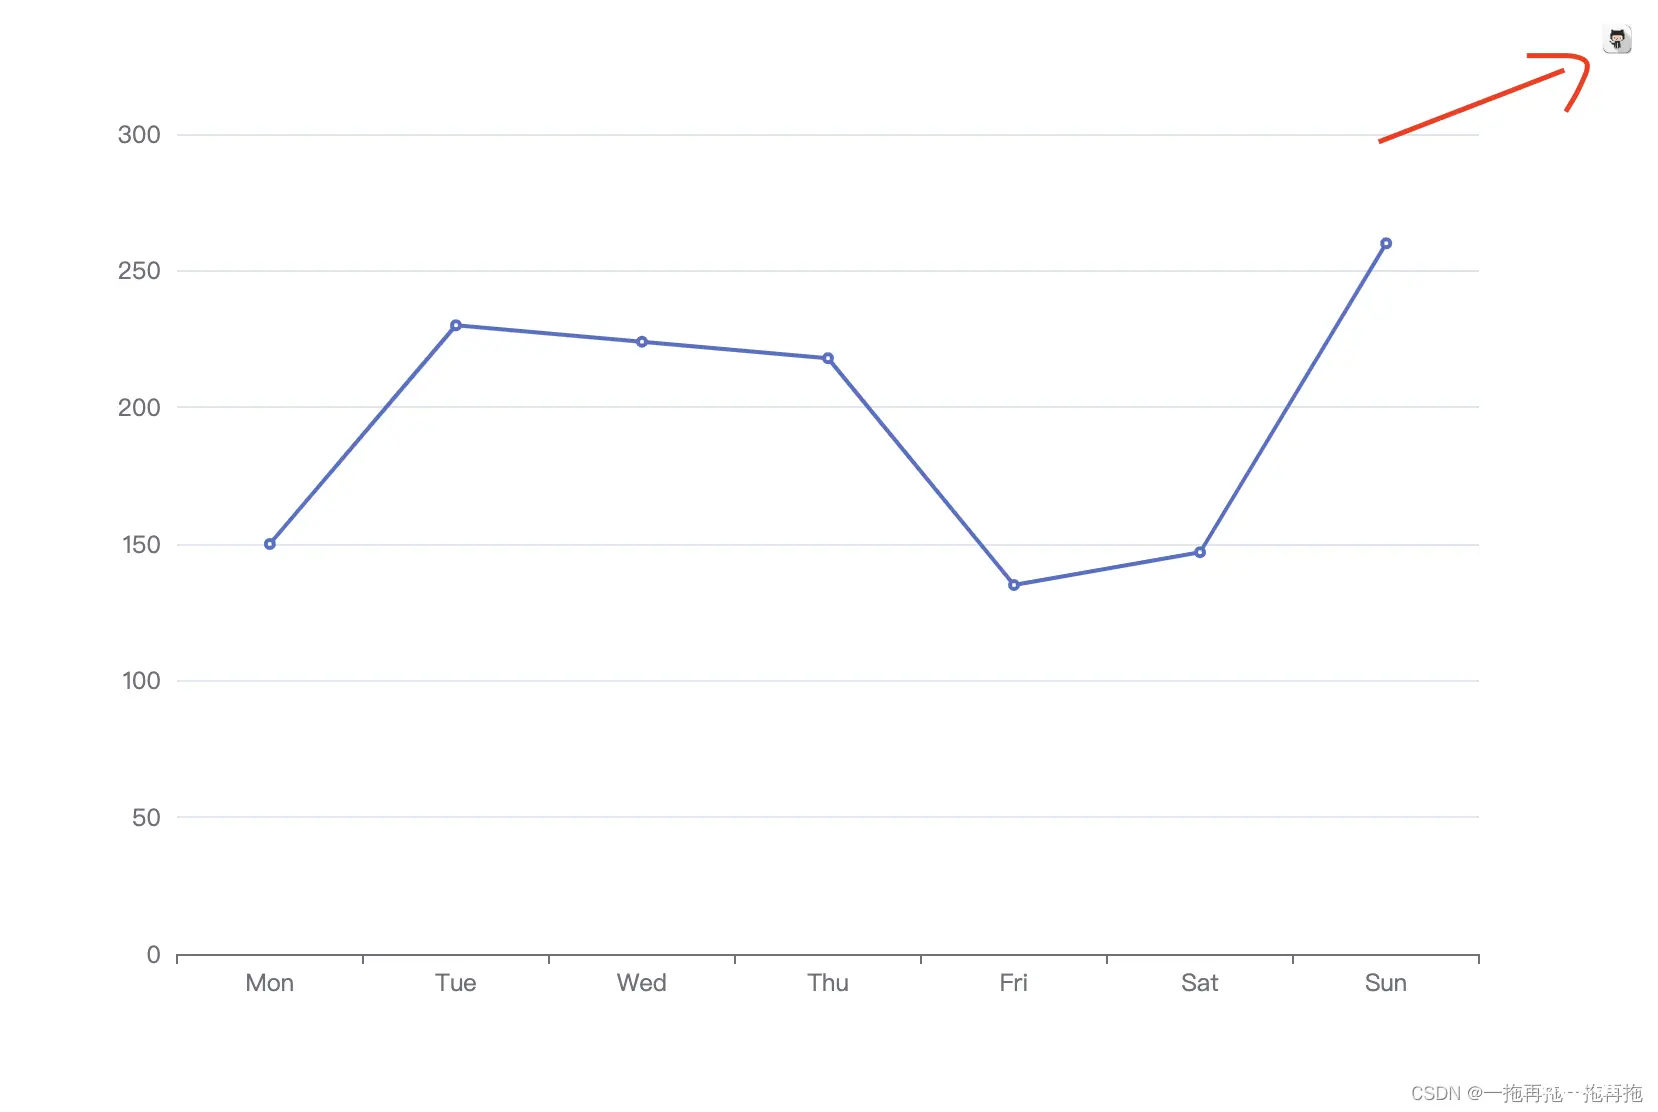
18:工具箱图标
option = { xAxis: { type: 'category', data: ['Mon', 'Tue', 'Wed', 'Thu', 'Fri', 'Sat', 'Sun'] }, yAxis: { type: 'value' }, toolbox: { feature: { saveAsImage: { icon: 'image://https://img.88icon.com/download/jpg/202001/388cc11b509232e7b5a2340742aba2ef.jpg!88con' } } }, series: [ { data: [150, 230, 224, 218, 135, 147, 260], type: 'line' } ]};
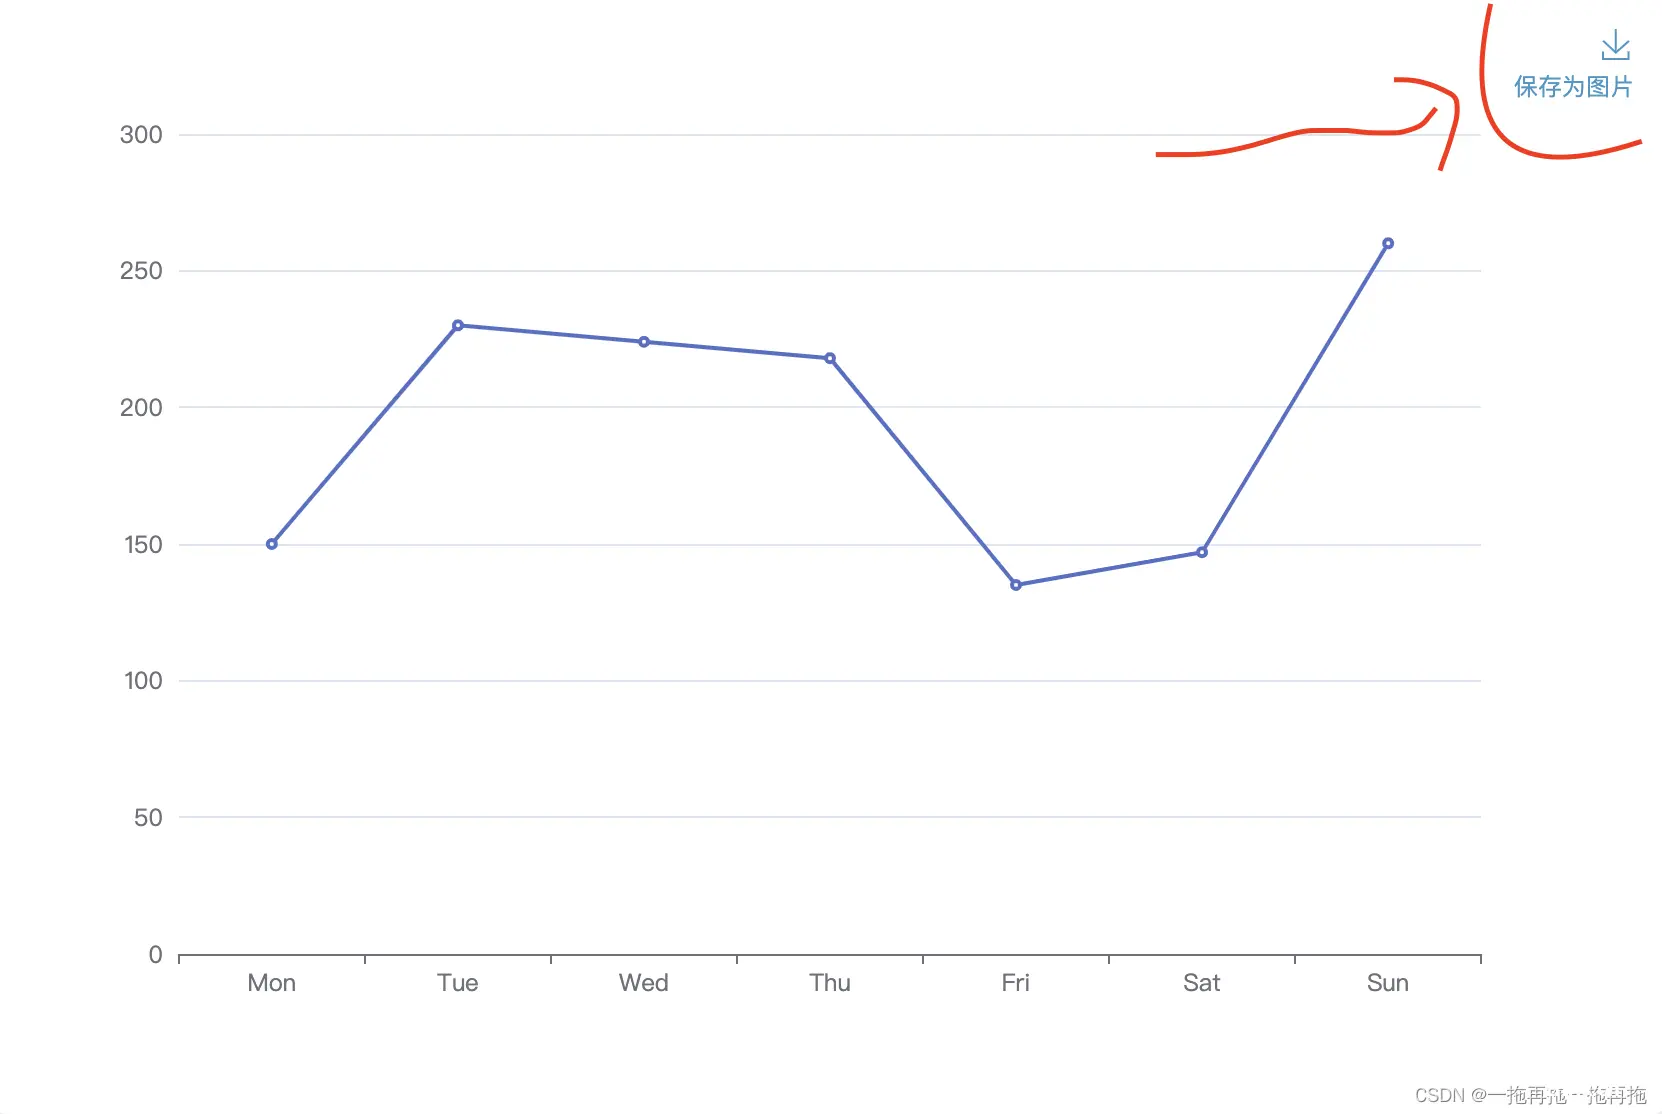
19:工具箱标题
option = { xAxis: { type: 'category', data: ['Mon', 'Tue', 'Wed', 'Thu', 'Fri', 'Sat', 'Sun'] }, yAxis: { type: 'value' }, toolbox: { feature: { saveAsImage: { title: '保存为图片' } } }, series: [ { data: [150, 230, 224, 218, 135, 147, 260], type: 'line' } ]};
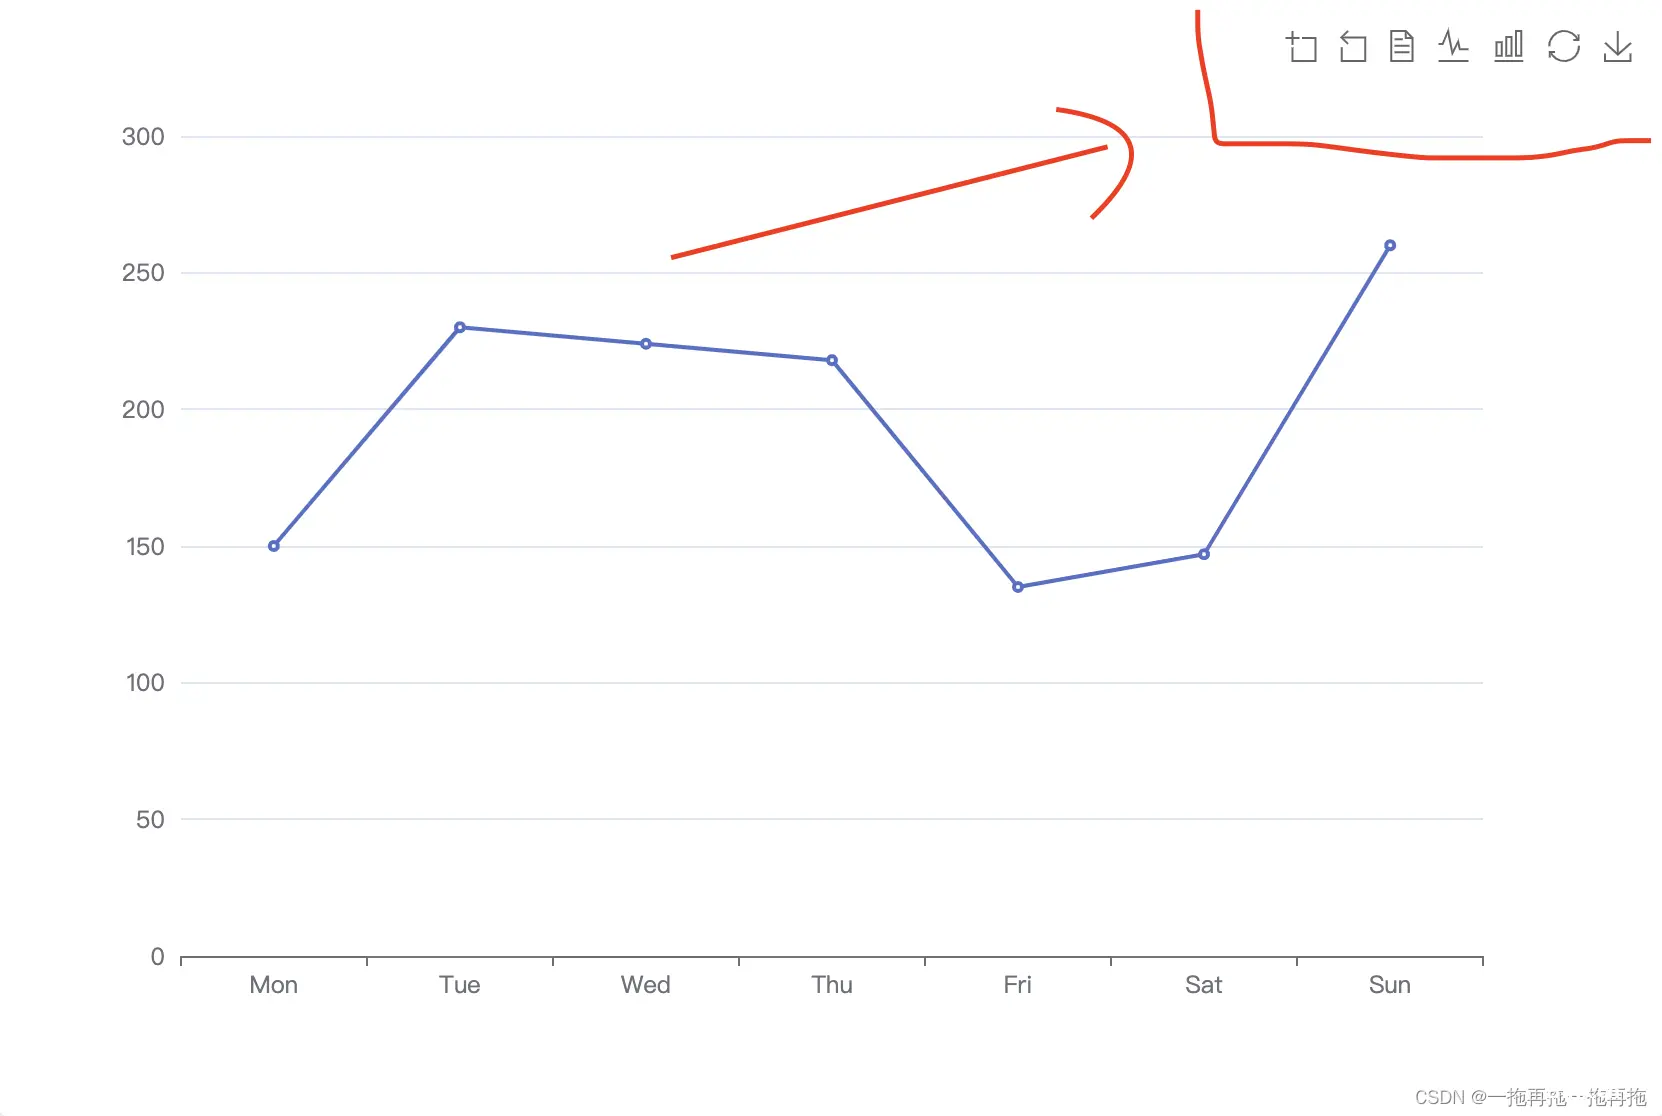
20:工具箱功能
option = { xAxis: { type: 'category', data: ['Mon', 'Tue', 'Wed', 'Thu', 'Fri', 'Sat', 'Sun'] }, yAxis: { type: 'value' }, toolbox: { feature: { dataZoom: { }, dataView: { readOnly: false}, magicType: { type: ['line', 'bar']}, restore: { }, saveAsImage: { } } }, series: [ { data: [150, 230, 224, 218, 135, 147, 260], type: 'line' } ]};
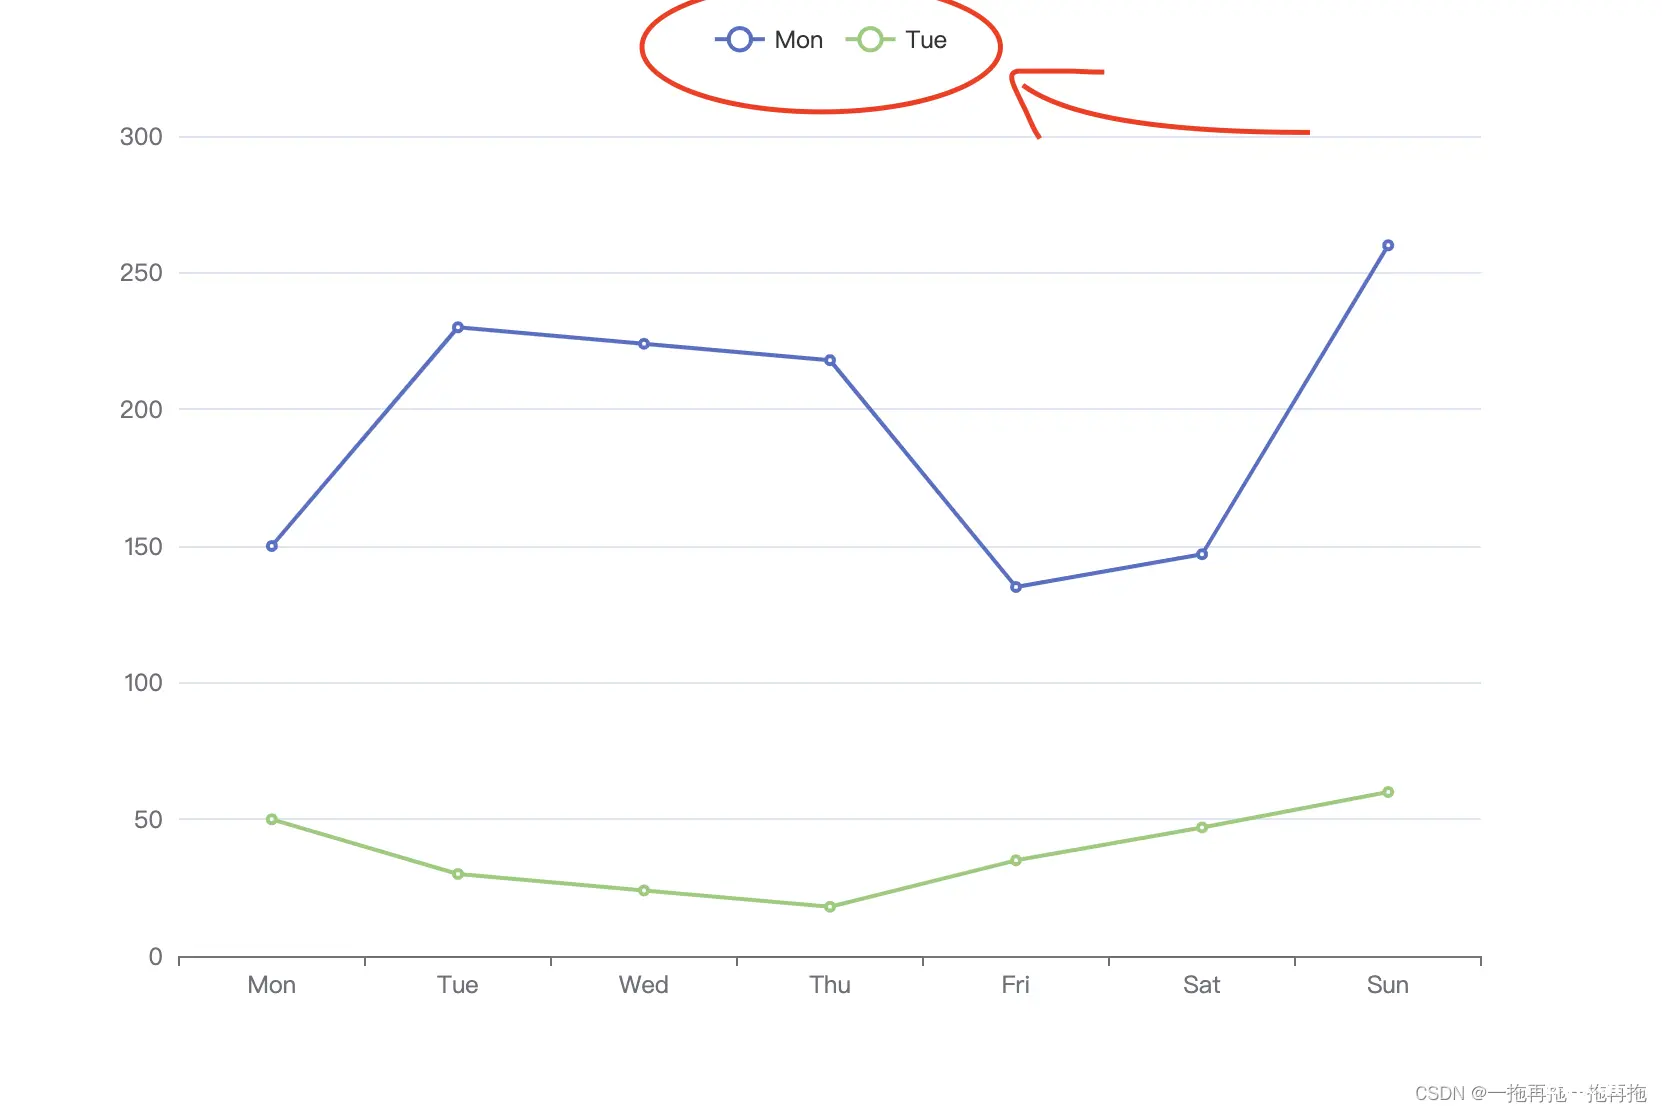
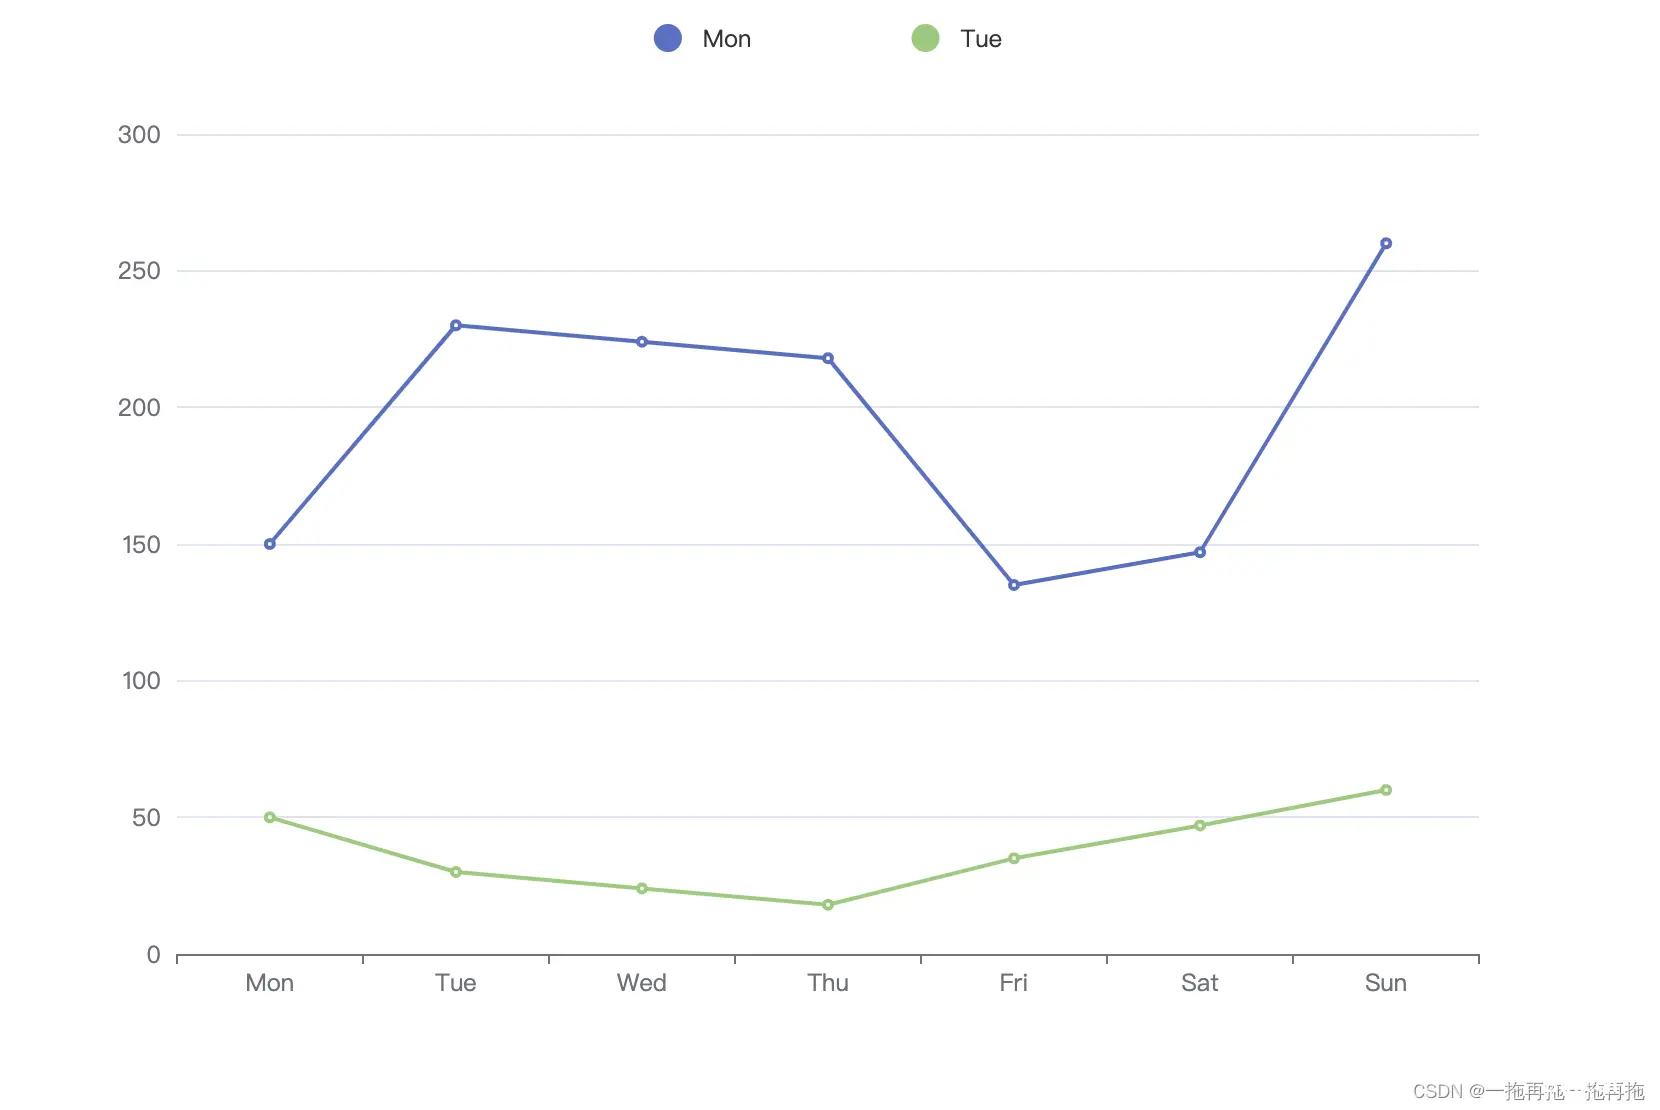
21:类别显示
option = { xAxis: { type: 'category', data: ['Mon', 'Tue', 'Wed', 'Thu', 'Fri', 'Sat', 'Sun'] }, yAxis: { type: 'value' }, legend: { data: ['Mon', 'Tue', 'Wed', 'Thu', 'Fri', 'Sat', 'Sun'] }, series: [ { name:'Mon', data: [150, 230, 224, 218, 135, 147, 260], type: 'line' }, { name:'Tue', data: [50, 30, 24, 18, 35, 47, 60], type: 'line' } ]};
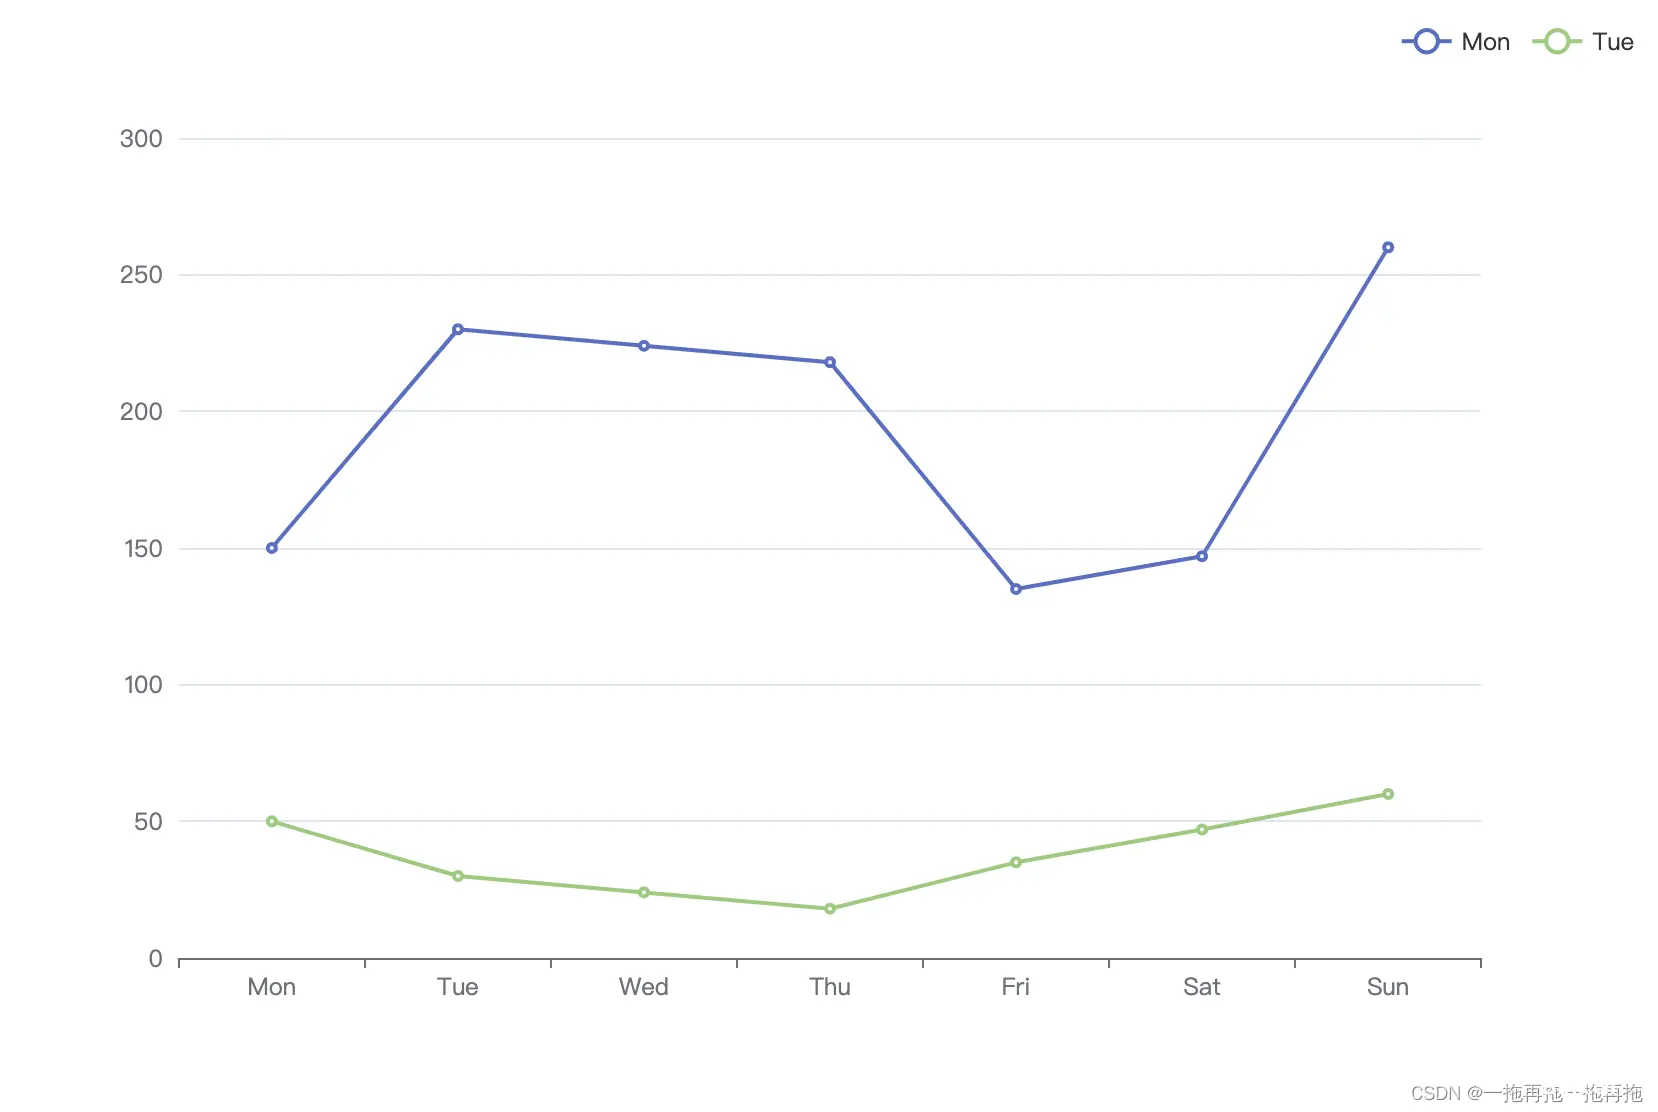
22:类别显示位置
option = { xAxis: { type: 'category', data: ['Mon', 'Tue', 'Wed', 'Thu', 'Fri', 'Sat', 'Sun'] }, yAxis: { type: 'value' }, legend: { data: ['Mon', 'Tue', 'Wed', 'Thu', 'Fri', 'Sat', 'Sun'], left: 'right' }, series: [ { name:'Mon', data: [150, 230, 224, 218, 135, 147, 260], type: 'line' }, { name:'Tue', data: [50, 30, 24, 18, 35, 47, 60], type: 'line' } ]};
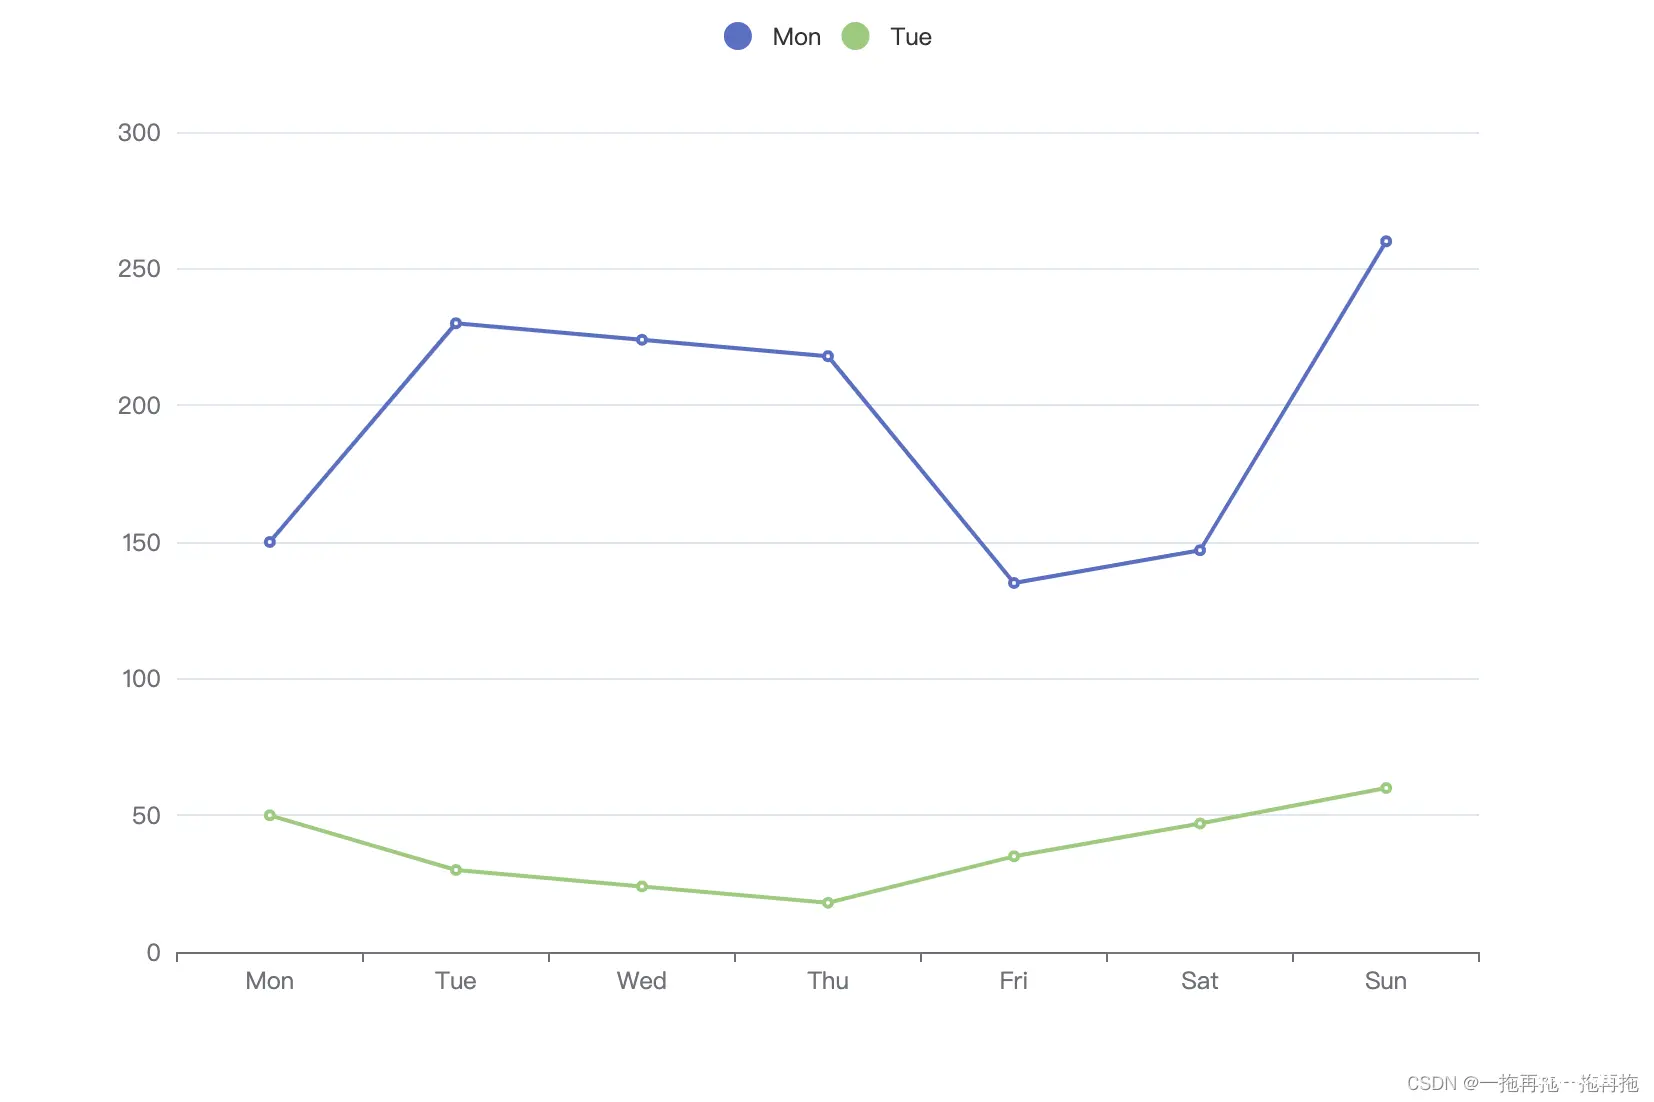
23:类别显示图标
option = { xAxis: { type: 'category', data: ['Mon', 'Tue', 'Wed', 'Thu', 'Fri', 'Sat', 'Sun'] }, yAxis: { type: 'value' }, legend: { data: ['Mon', 'Tue', 'Wed', 'Thu', 'Fri', 'Sat', 'Sun'], icon: 'circle' }, series: [ { name:'Mon', data: [150, 230, 224, 218, 135, 147, 260], type: 'line' }, { name:'Tue', data: [50, 30, 24, 18, 35, 47, 60], type: 'line' } ]};
24:类别显示图标大小
option = { xAxis: { type: 'category', data: ['Mon', 'Tue', 'Wed', 'Thu', 'Fri', 'Sat', 'Sun'] }, yAxis: { type: 'value' }, legend: { data: ['Mon', 'Tue', 'Wed', 'Thu', 'Fri', 'Sat', 'Sun'], icon: 'circle', itemWidth: 20, itemHeight: 20 }, series: [ { name:'Mon', data: [150, 230, 224, 218, 135, 147, 260], type: 'line' }, { name:'Tue', data: [50, 30, 24, 18, 35, 47, 60], type: 'line' } ]};
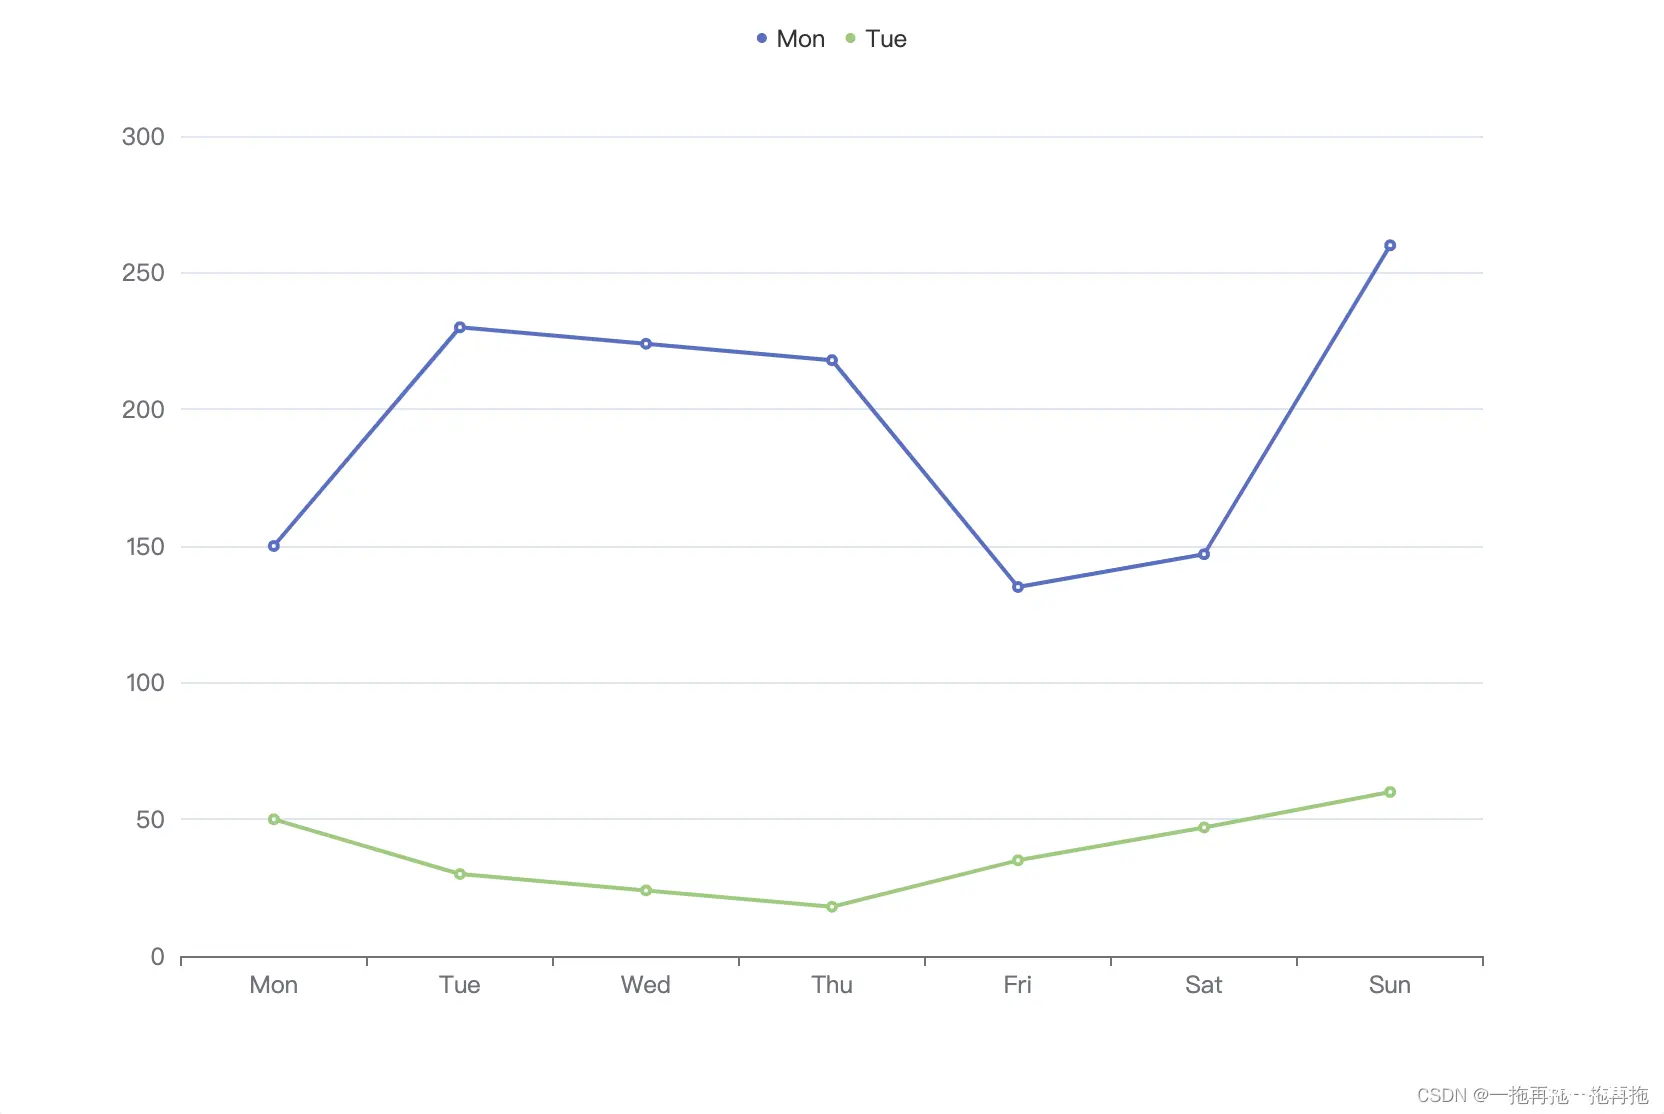
25:类别显示图标间距
option = { xAxis: { type: 'category', data: ['Mon', 'Tue', 'Wed', 'Thu', 'Fri', 'Sat', 'Sun'] }, yAxis: { type: 'value' }, legend: { data: ['Mon', 'Tue', 'Wed', 'Thu', 'Fri', 'Sat', 'Sun'], icon: 'circle', itemGap: 20 }, series: [ { name:'Mon', data: [150, 230, 224, 218, 135, 147, 260], type: 'line' }, { name:'Tue', data: [50, 30, 24, 18, 35, 47, 60], type: 'line' } ]};
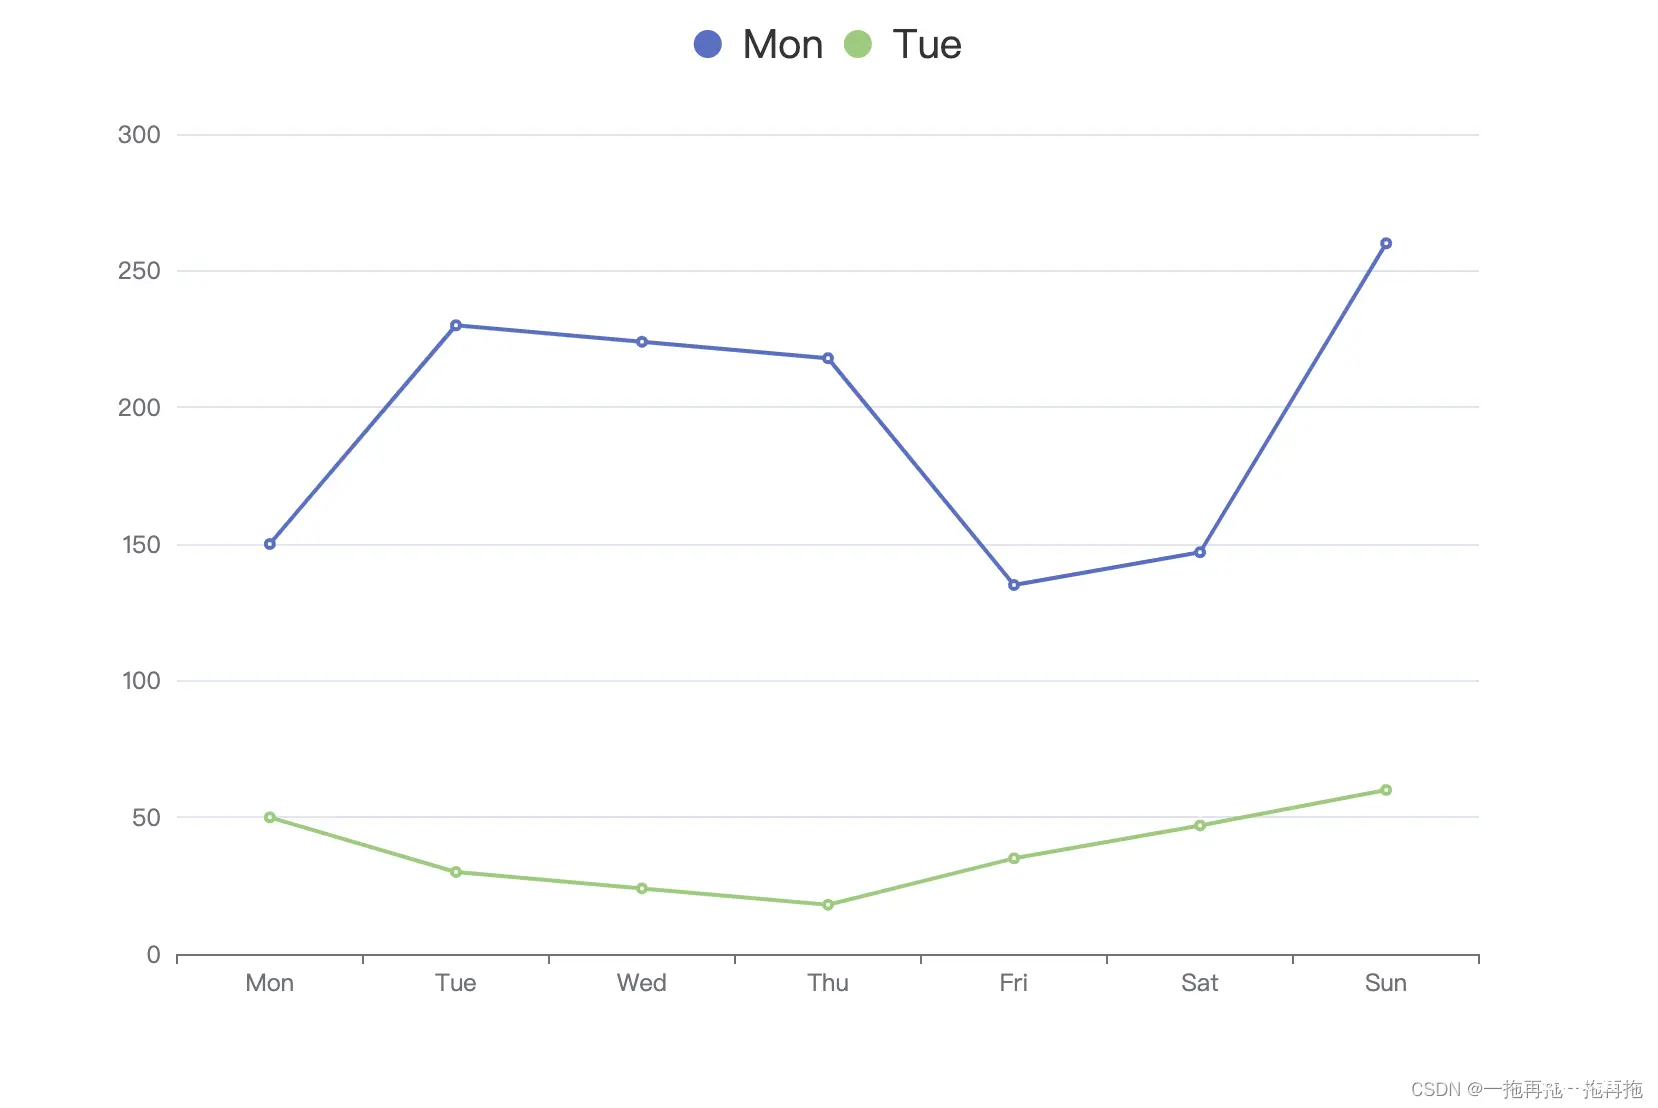
26:类别显示图标文字大小
option = { xAxis: { type: 'category', data: ['Mon', 'Tue', 'Wed', 'Thu', 'Fri', 'Sat', 'Sun'] }, yAxis: { type: 'value' }, legend: { data: ['Mon', 'Tue', 'Wed', 'Thu', 'Fri', 'Sat', 'Sun'], icon: 'circle', textStyle: { fontSize: 20 } }, series: [ { name:'Mon', data: [150, 230, 224, 218, 135, 147, 260], type: 'line' }, { name:'Tue', data: [50, 30, 24, 18, 35, 47, 60], type: 'line' } ]};
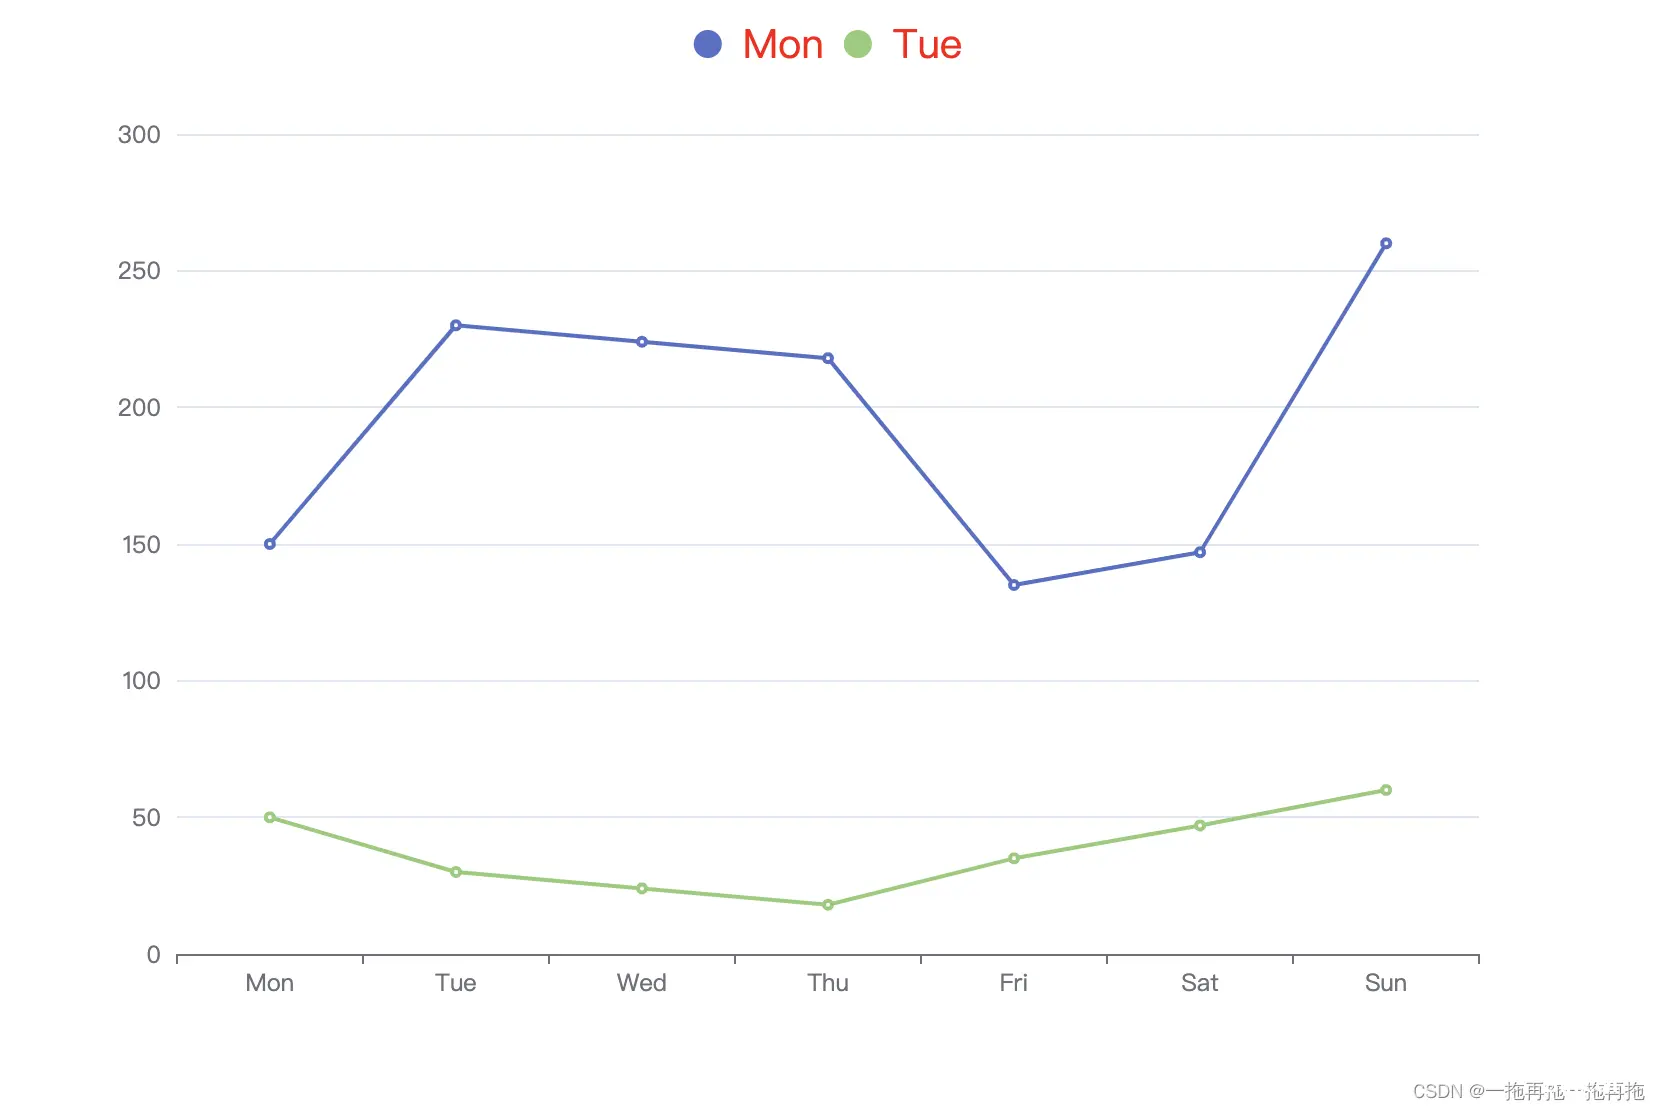
27:类别显示图标文字颜色
option = { xAxis: { type: 'category', data: ['Mon', 'Tue', 'Wed', 'Thu', 'Fri', 'Sat', 'Sun'] }, yAxis: { type: 'value' }, legend: { data: ['Mon', 'Tue', 'Wed', 'Thu', 'Fri', 'Sat', 'Sun'], icon: 'circle', textStyle: { color: 'red' } }, series: [ { name:'Mon', data: [150, 230, 224, 218, 135, 147, 260], type: 'line' }, { name:'Tue', data: [50, 30, 24, 18, 35, 47, 60], type: 'line' } ]};
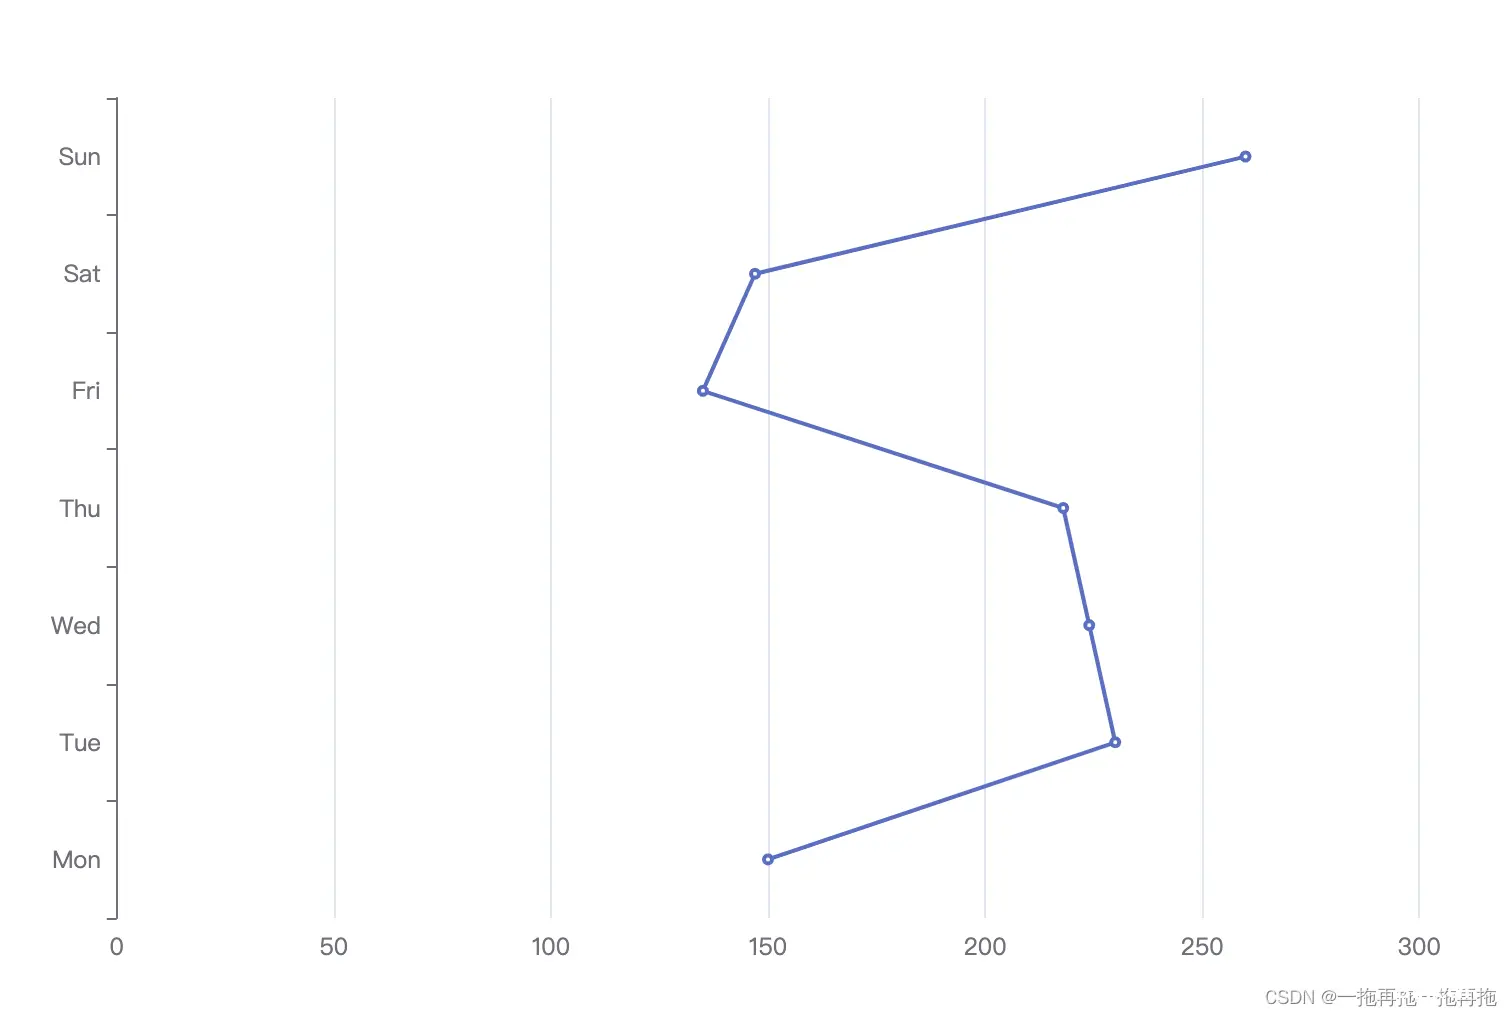
28:轴方向(同其他,如柱状图等)
option = { xAxis: { type: 'value' }, yAxis: { type: 'category', data: ['Mon', 'Tue', 'Wed', 'Thu', 'Fri', 'Sat', 'Sun'] }, series: [ { data: [150, 230, 224, 218, 135, 147, 260], type: 'line' } ]};
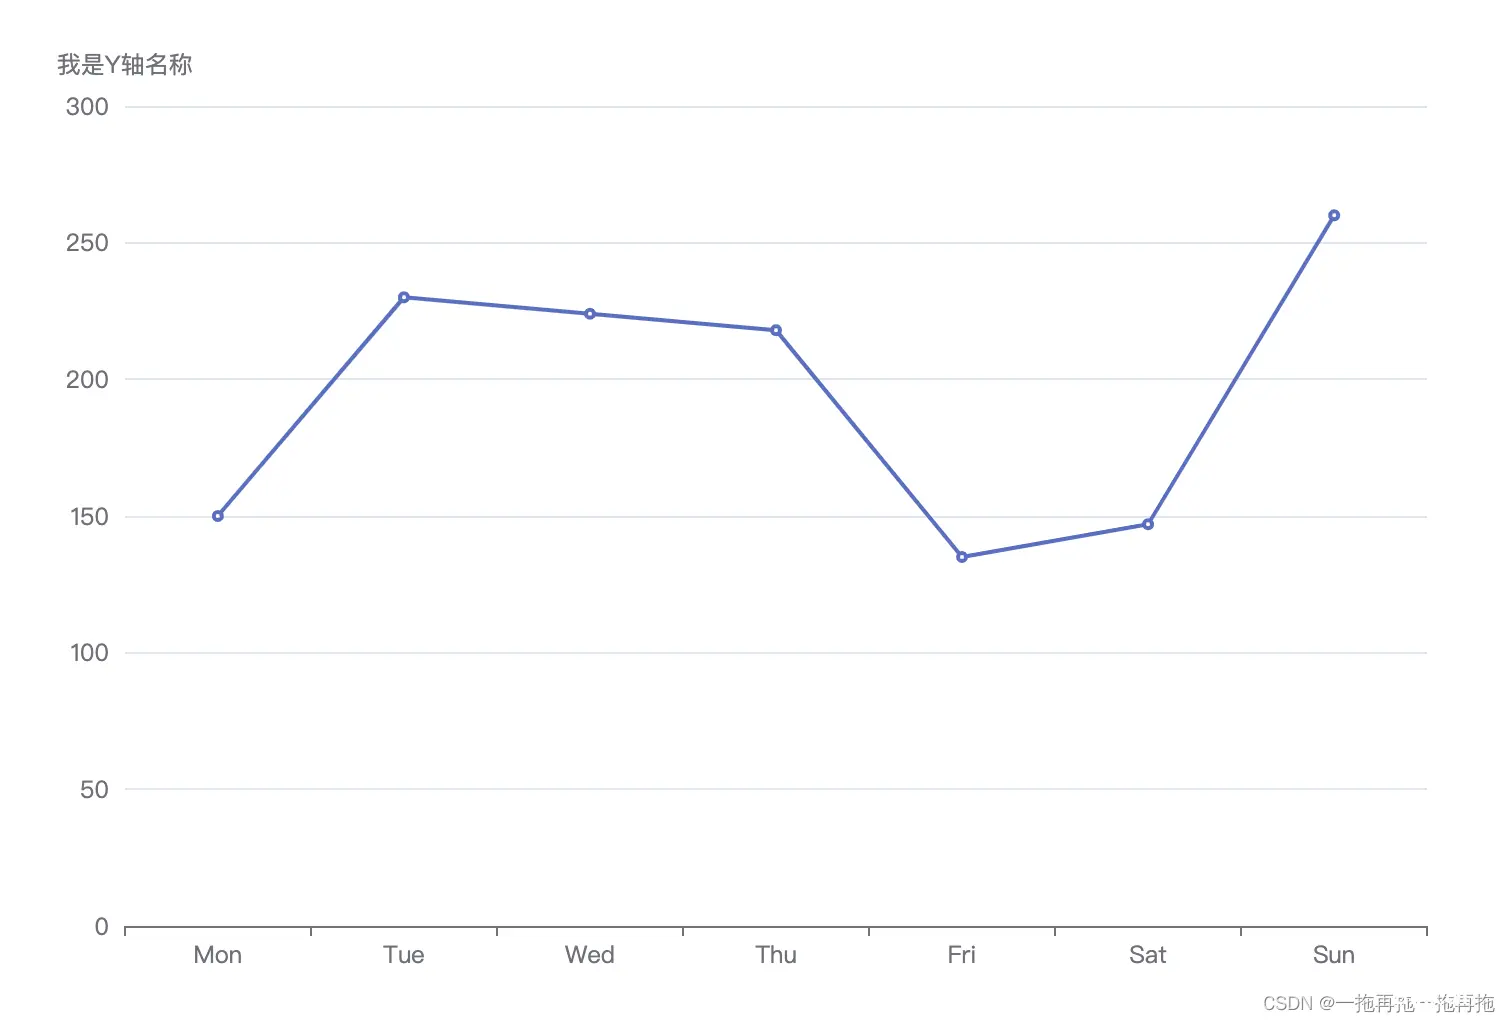
29:坐标轴名称
option = { xAxis: { type: 'category', data: ['Mon', 'Tue', 'Wed', 'Thu', 'Fri', 'Sat', 'Sun'] }, yAxis: { type: 'value', name: '我是Y轴名称' }, series: [ { data: [150, 230, 224, 218, 135, 147, 260], type: 'line' } ]};
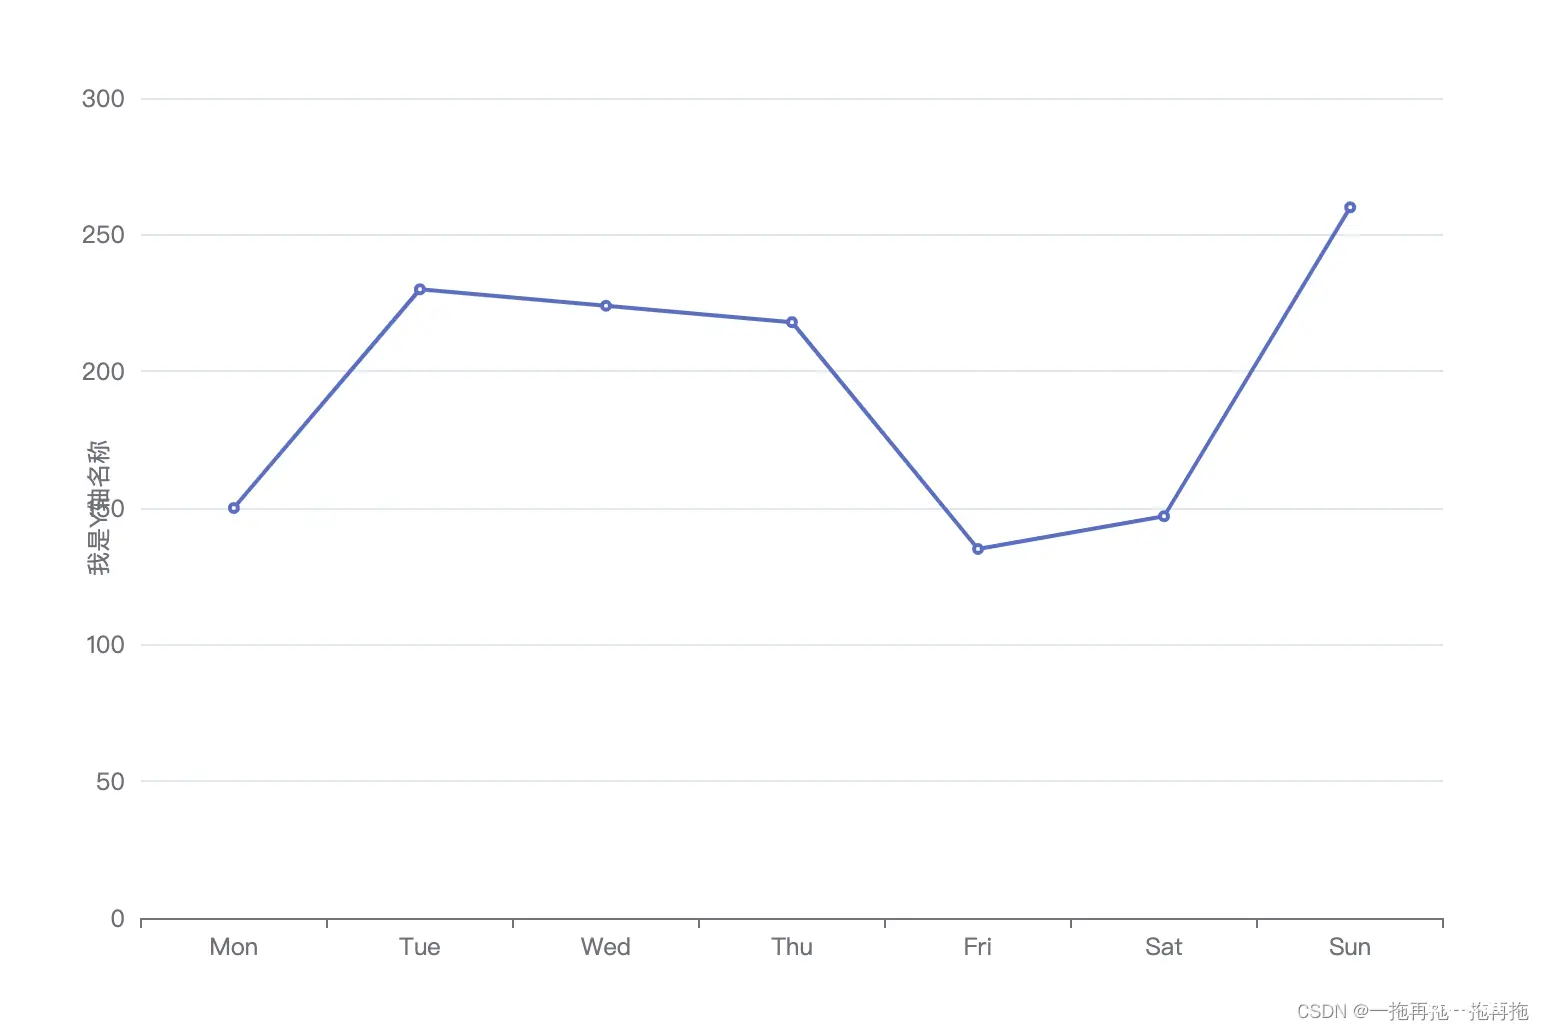
30:坐标轴名称位置
option = { xAxis: { type: 'category', data: ['Mon', 'Tue', 'Wed', 'Thu', 'Fri', 'Sat', 'Sun'] }, yAxis: { type: 'value', name: '我是Y轴名称', nameLocation: 'middle' }, series: [ { data: [150, 230, 224, 218, 135, 147, 260], type: 'line' } ]};
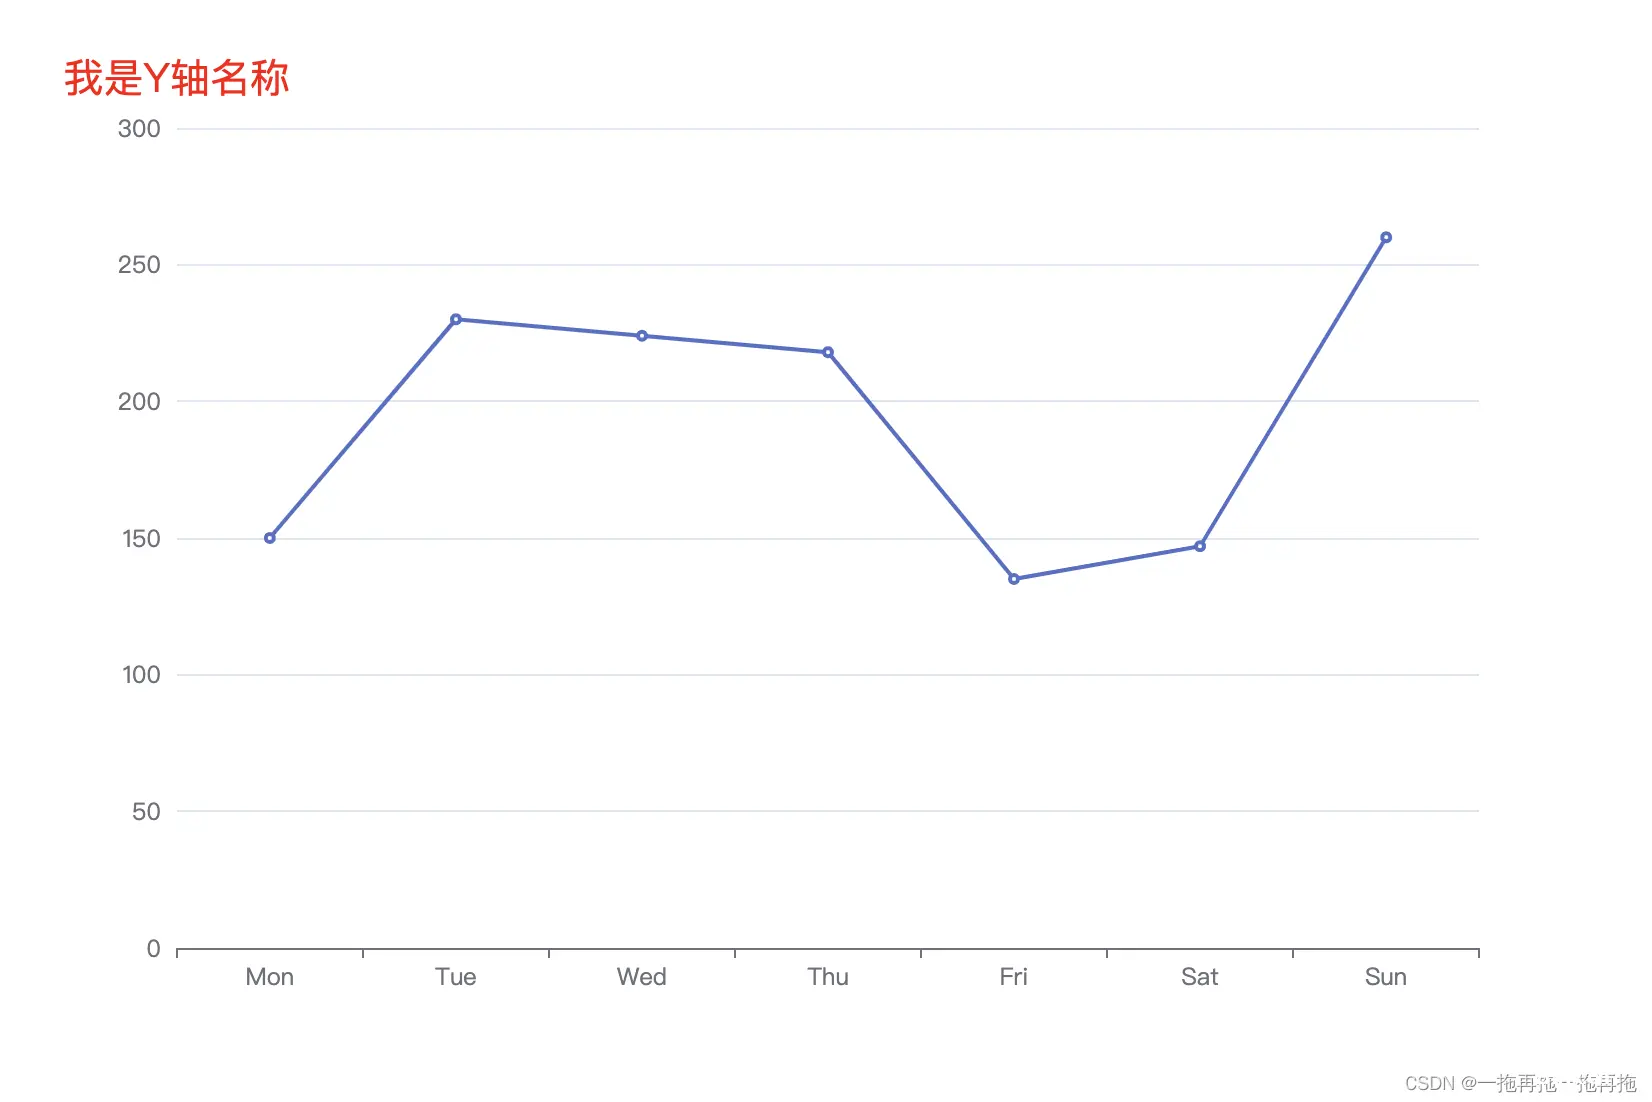
31:坐标轴名称文字样式
option = { xAxis: { type: 'category', data: ['Mon', 'Tue', 'Wed', 'Thu', 'Fri', 'Sat', 'Sun'] }, yAxis: { type: 'value', name: '我是Y轴名称', nameTextStyle: { color: 'red', fontSize: 20 } }, series: [ { data: [150, 230, 224, 218, 135, 147, 260], type: 'line' } ]};
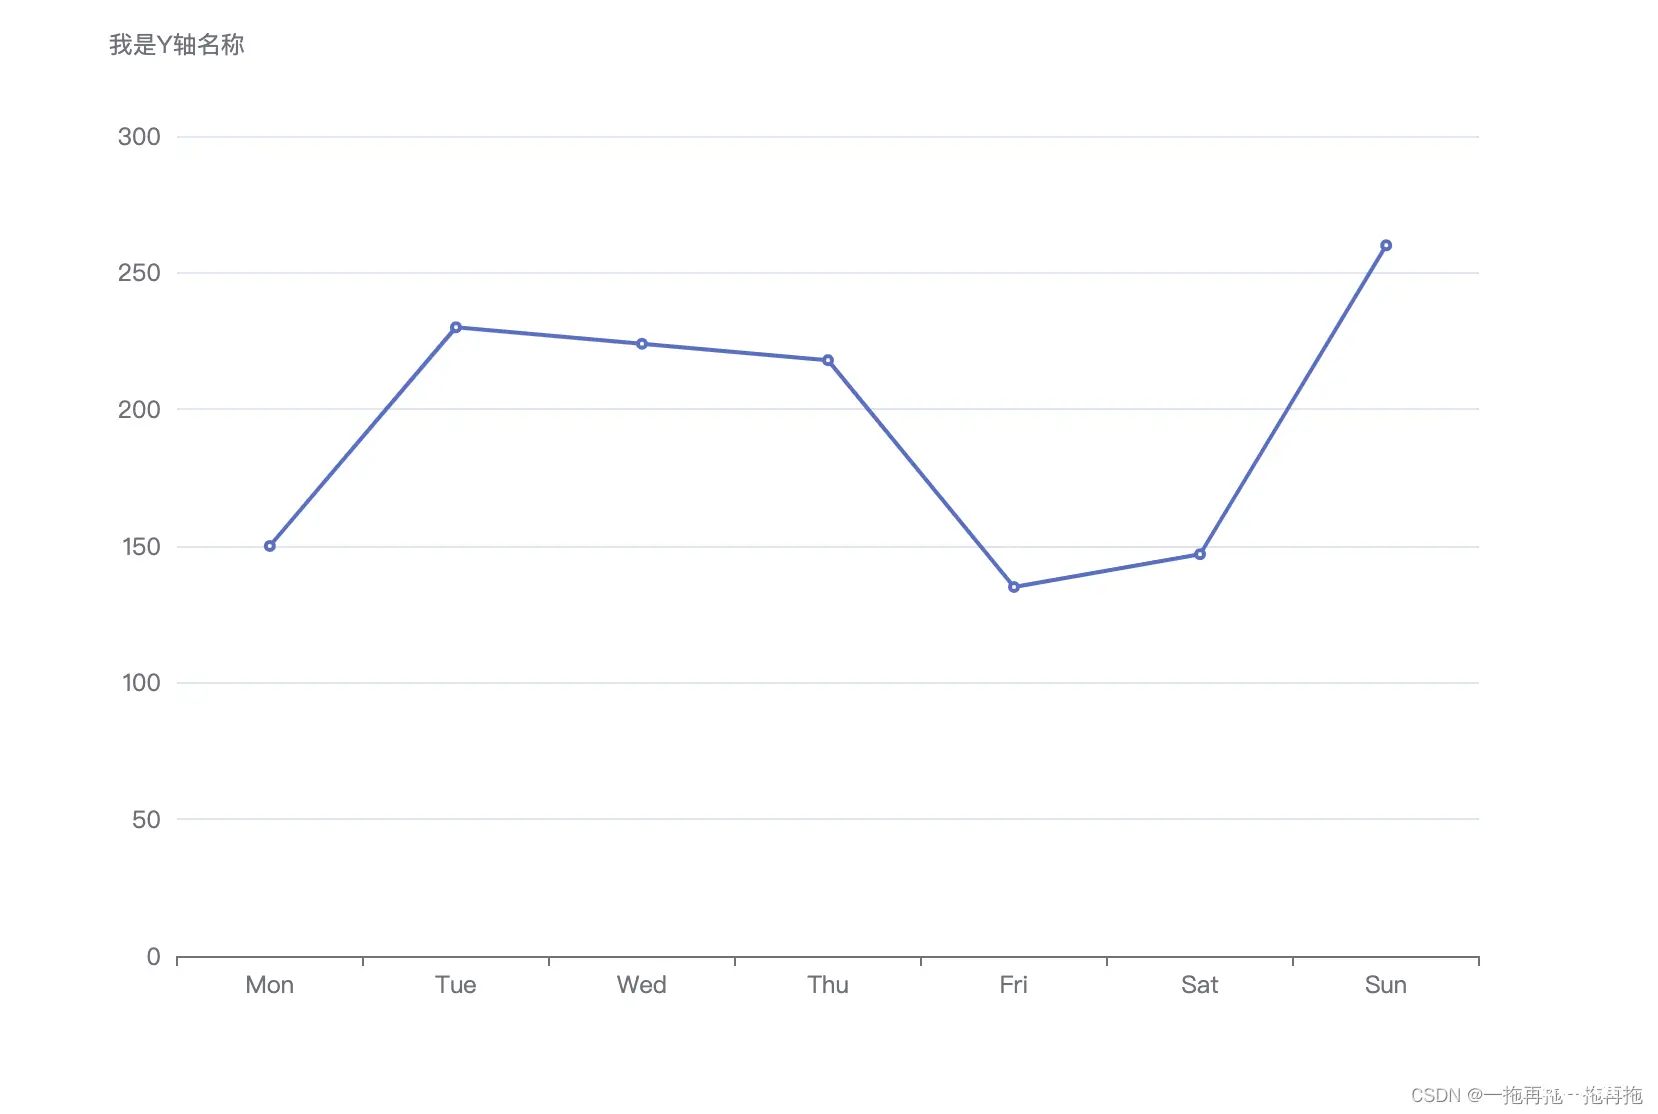
32:坐标轴名称与轴线之间的距离
option = { xAxis: { type: 'category', data: ['Mon', 'Tue', 'Wed', 'Thu', 'Fri', 'Sat', 'Sun'] }, yAxis: { type: 'value', name: '我是Y轴名称', nameGap: 20 }, series: [ { data: [150, 230, 224, 218, 135, 147, 260], type: 'line' } ]};
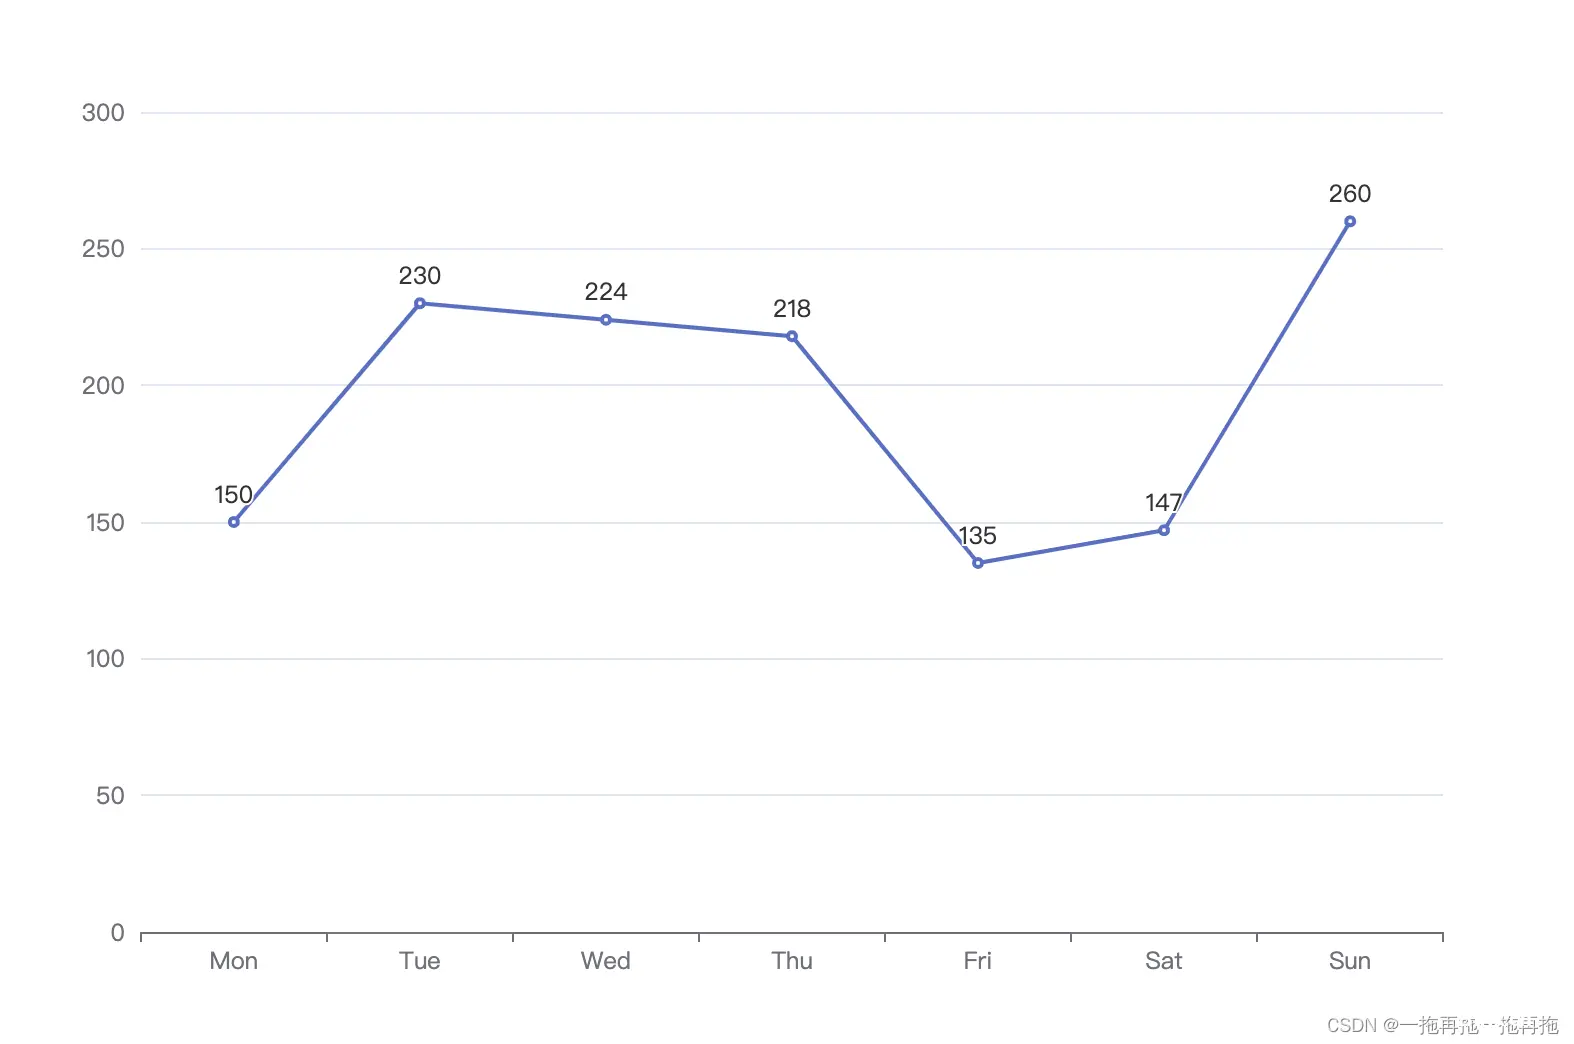
33:显示标签
option = { xAxis: { type: 'category', data: ['Mon', 'Tue', 'Wed', 'Thu', 'Fri', 'Sat', 'Sun'] }, yAxis: { type: 'value' }, series: [ { data: [150, 230, 224, 218, 135, 147, 260], type: 'line', label: { show: true } } ]};
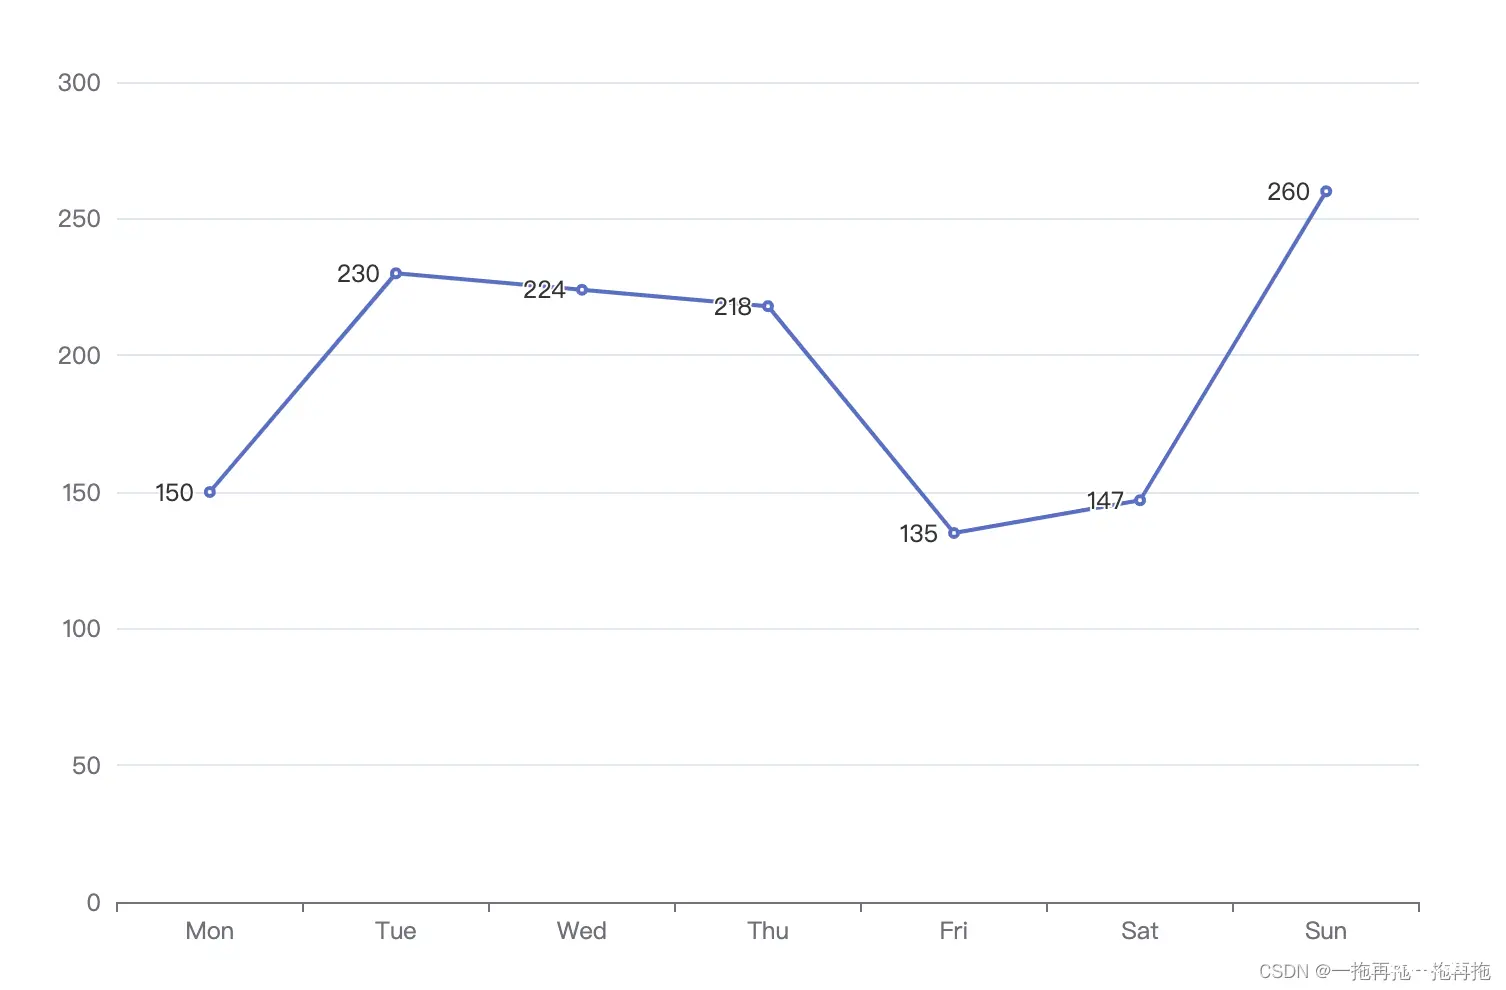
34:标签位置
option = { xAxis: { type: 'category', data: ['Mon', 'Tue', 'Wed', 'Thu', 'Fri', 'Sat', 'Sun'] }, yAxis: { type: 'value' }, series: [ { data: [150, 230, 224, 218, 135, 147, 260], type: 'line', label: { show: true, position: 'left' } } ]};
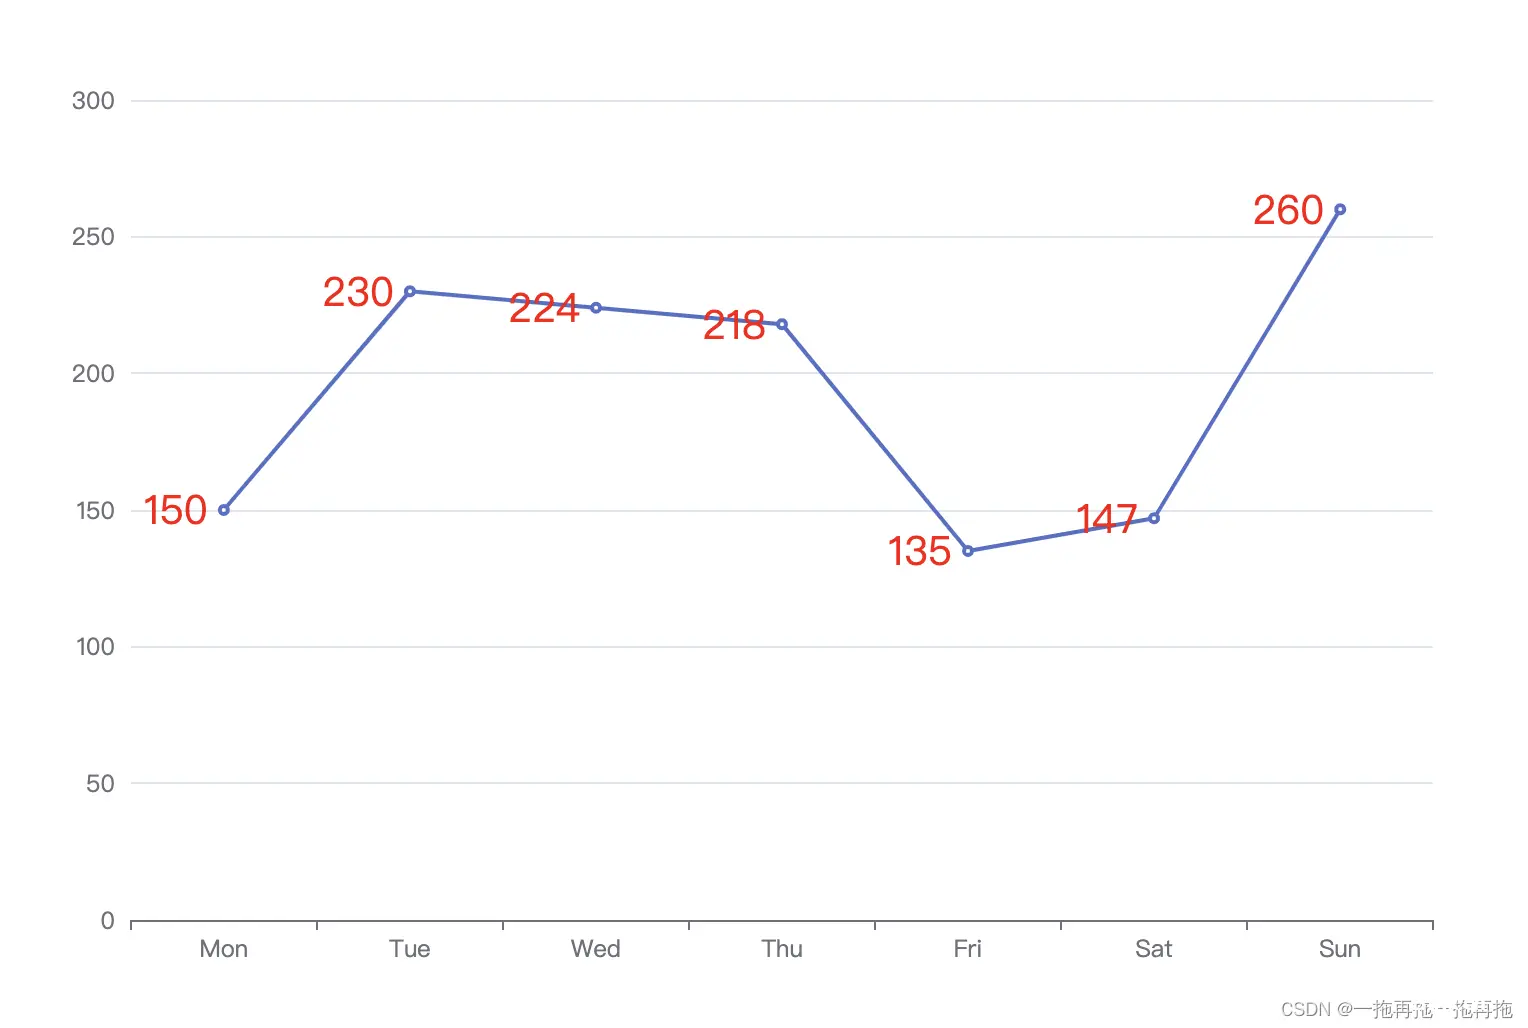
35:标签文字样式
option = { xAxis: { type: 'category', data: ['Mon', 'Tue', 'Wed', 'Thu', 'Fri', 'Sat', 'Sun'] }, yAxis: { type: 'value' }, series: [ { data: [150, 230, 224, 218, 135, 147, 260], type: 'line', label: { show: true, position: 'left', textStyle: { color: 'red', fontSize: 20 } } } ]};
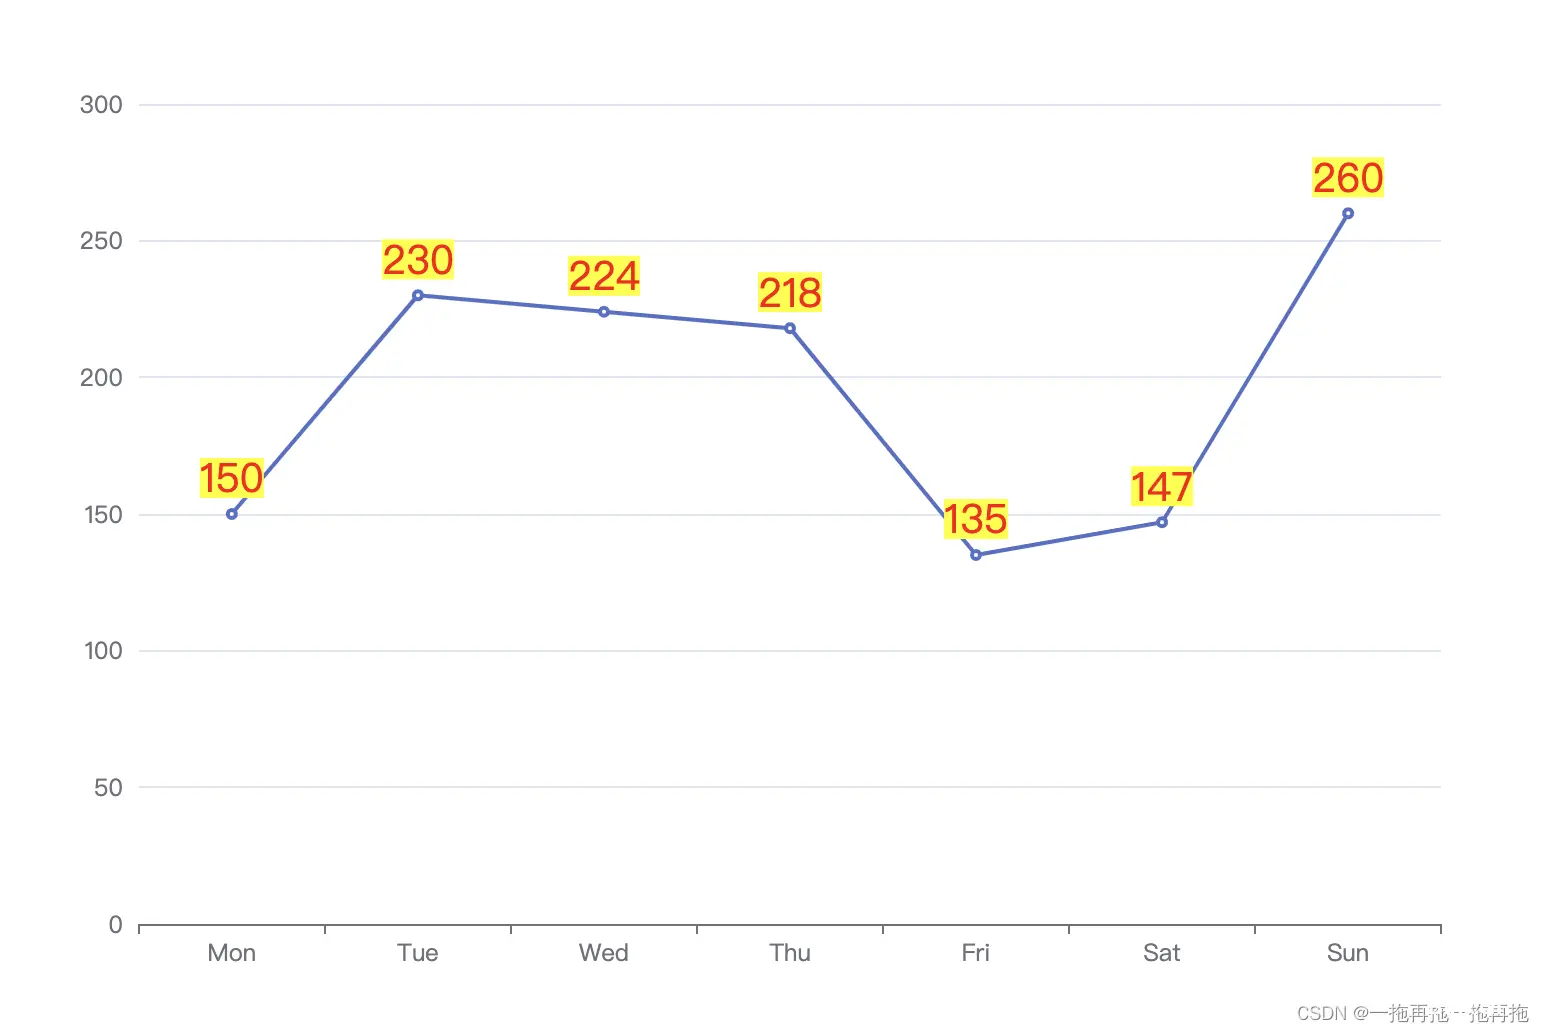
36:标签背景色
option = { xAxis: { type: 'category', data: ['Mon', 'Tue', 'Wed', 'Thu', 'Fri', 'Sat', 'Sun'] }, yAxis: { type: 'value' }, series: [ { data: [150, 230, 224, 218, 135, 147, 260], type: 'line', label: { show: true, textStyle: { color: 'red', fontSize: 20 }, backgroundColor: 'yellow' } } ]};
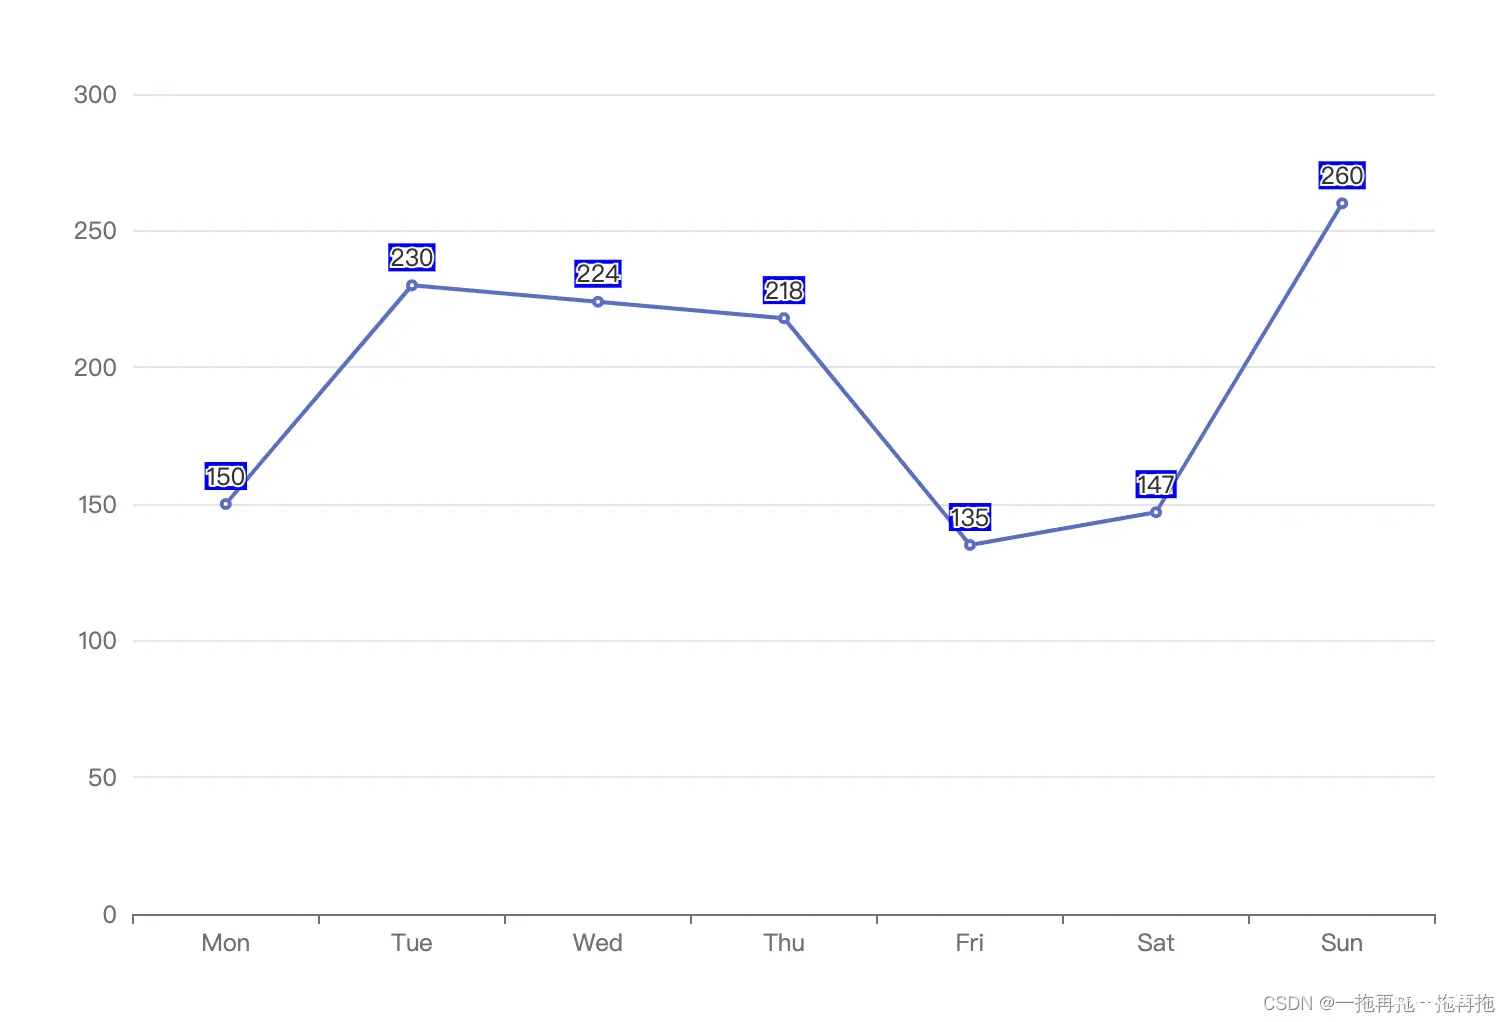
37:标签边框
option = { xAxis: { type: 'category', data: ['Mon', 'Tue', 'Wed', 'Thu', 'Fri', 'Sat', 'Sun'] }, yAxis: { type: 'value' }, series: [ { data: [150, 230, 224, 218, 135, 147, 260], type: 'line', label: { show: true, borderColor: 'blue', borderWidth: 2 } } ]};
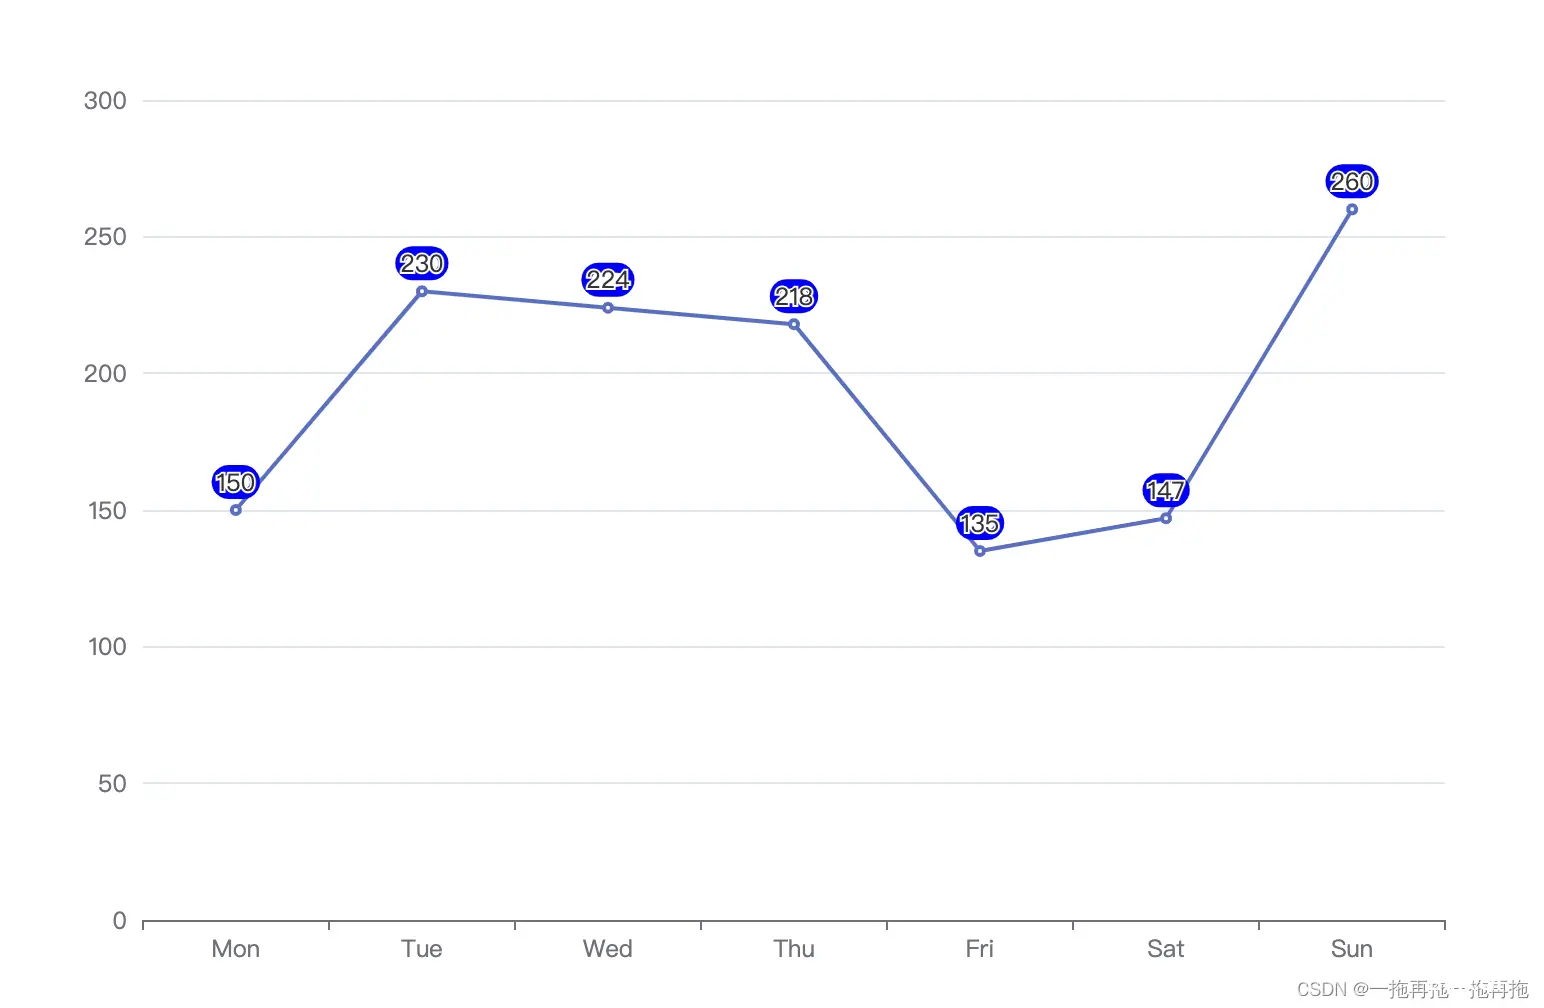
38:标签边框圆角
option = { xAxis: { type: 'category', data: ['Mon', 'Tue', 'Wed', 'Thu', 'Fri', 'Sat', 'Sun'] }, yAxis: { type: 'value' }, series: [ { data: [150, 230, 224, 218, 135, 147, 260], type: 'line', label: { show: true, borderRadius: 10 } } ]};
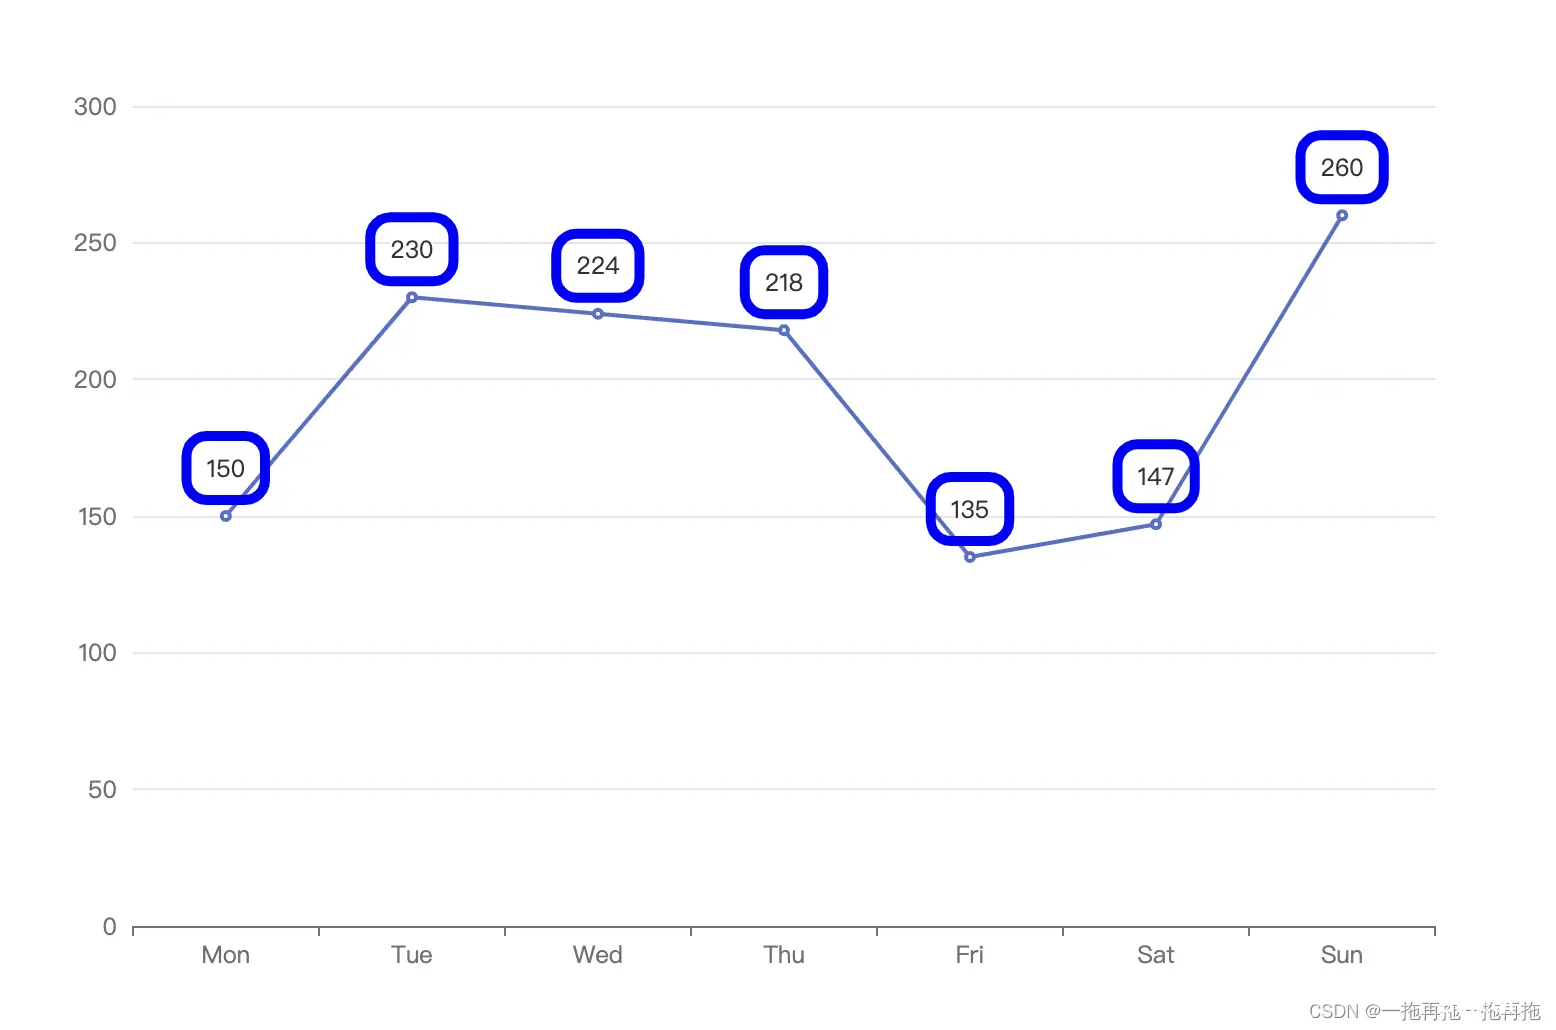
39:标签内边距
option = { xAxis: { type: 'category', data: ['Mon', 'Tue', 'Wed', 'Thu', 'Fri', 'Sat', 'Sun'] }, yAxis: { type: 'value' }, series: [ { data: [150, 230, 224, 218, 135, 147, 260], type: 'line', label: { show: true, borderColor: 'blue', borderWidth: 5, borderRadius: 10, padding: 10 } } ]};
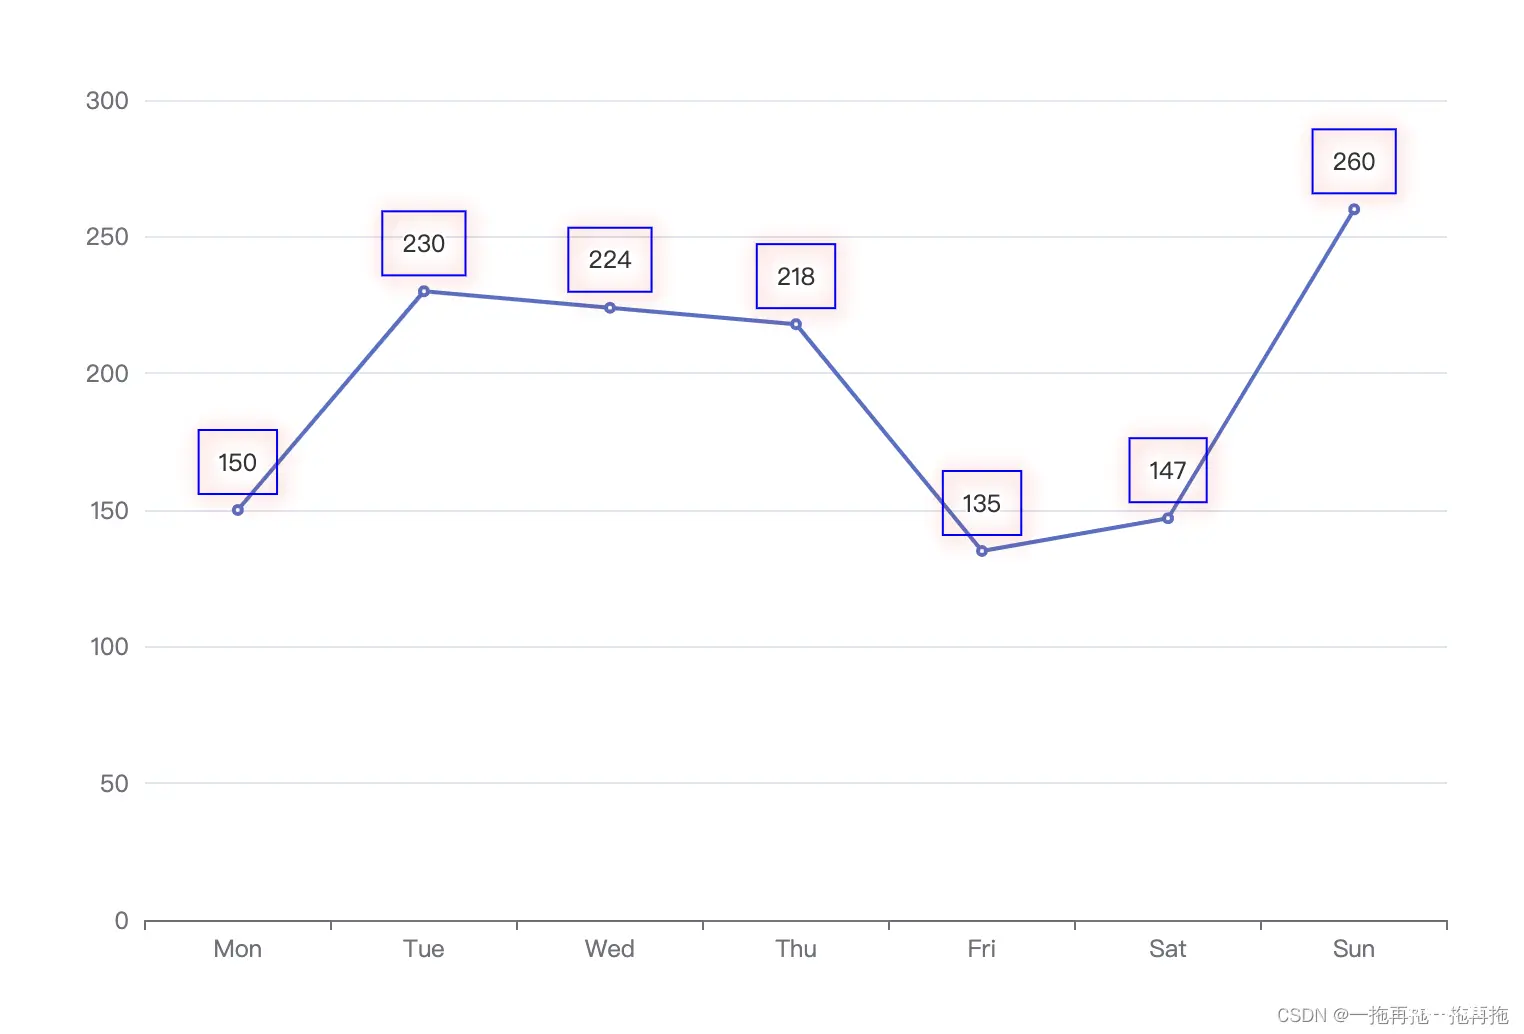
40:标签阴影
option = { xAxis: { type: 'category', data: ['Mon', 'Tue', 'Wed', 'Thu', 'Fri', 'Sat', 'Sun'] }, yAxis: { type: 'value' }, series: [ { data: [150, 230, 224, 218, 135, 147, 260], type: 'line', label: { show: true, borderColor: 'blue', borderWidth: 1, padding: 10, shadowColor: 'red', shadowBlur: 10, shadowOffsetX: 1, shadowOffsetY: 1 } } ]};
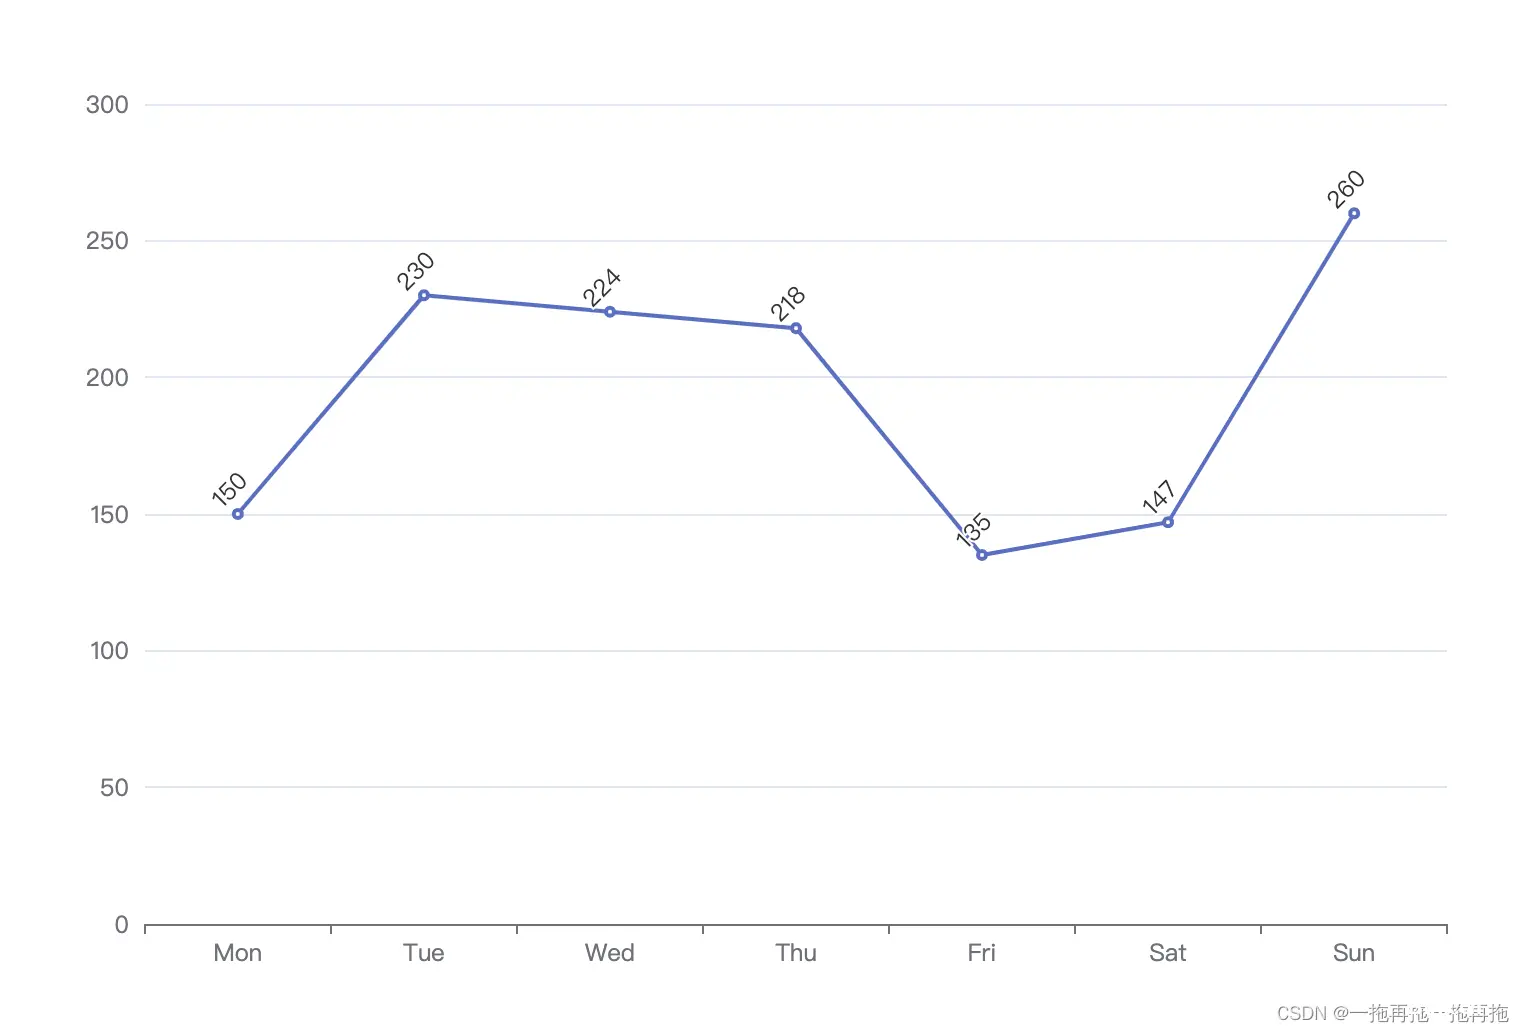
41:标签旋转
option = { xAxis: { type: 'category', data: ['Mon', 'Tue', 'Wed', 'Thu', 'Fri', 'Sat', 'Sun'] }, yAxis: { type: 'value' }, series: [ { data: [150, 230, 224, 218, 135, 147, 260], type: 'line', label: { show: true, rotate: 45 } } ]};
---------更新 2013 04 13---------
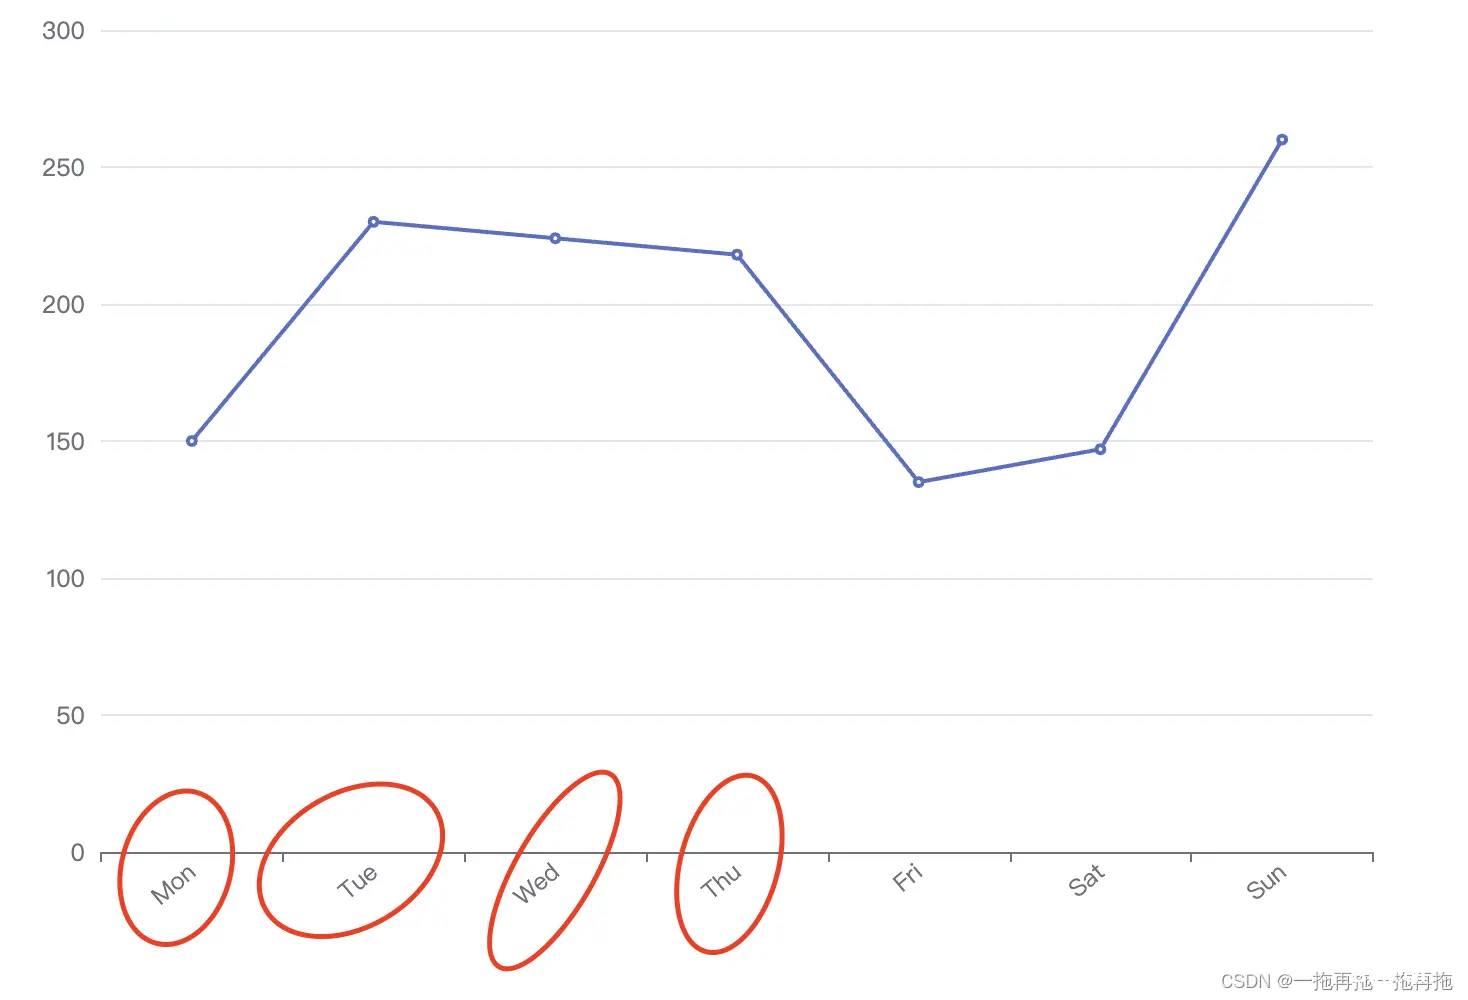
42:x轴内容偏移
xAxis: { data: ['Mon', 'Tue', 'Wed', 'Thu', 'Fri', 'Sat', 'Sun'], axisLabel: { interval: 0, rotate: 40 } }
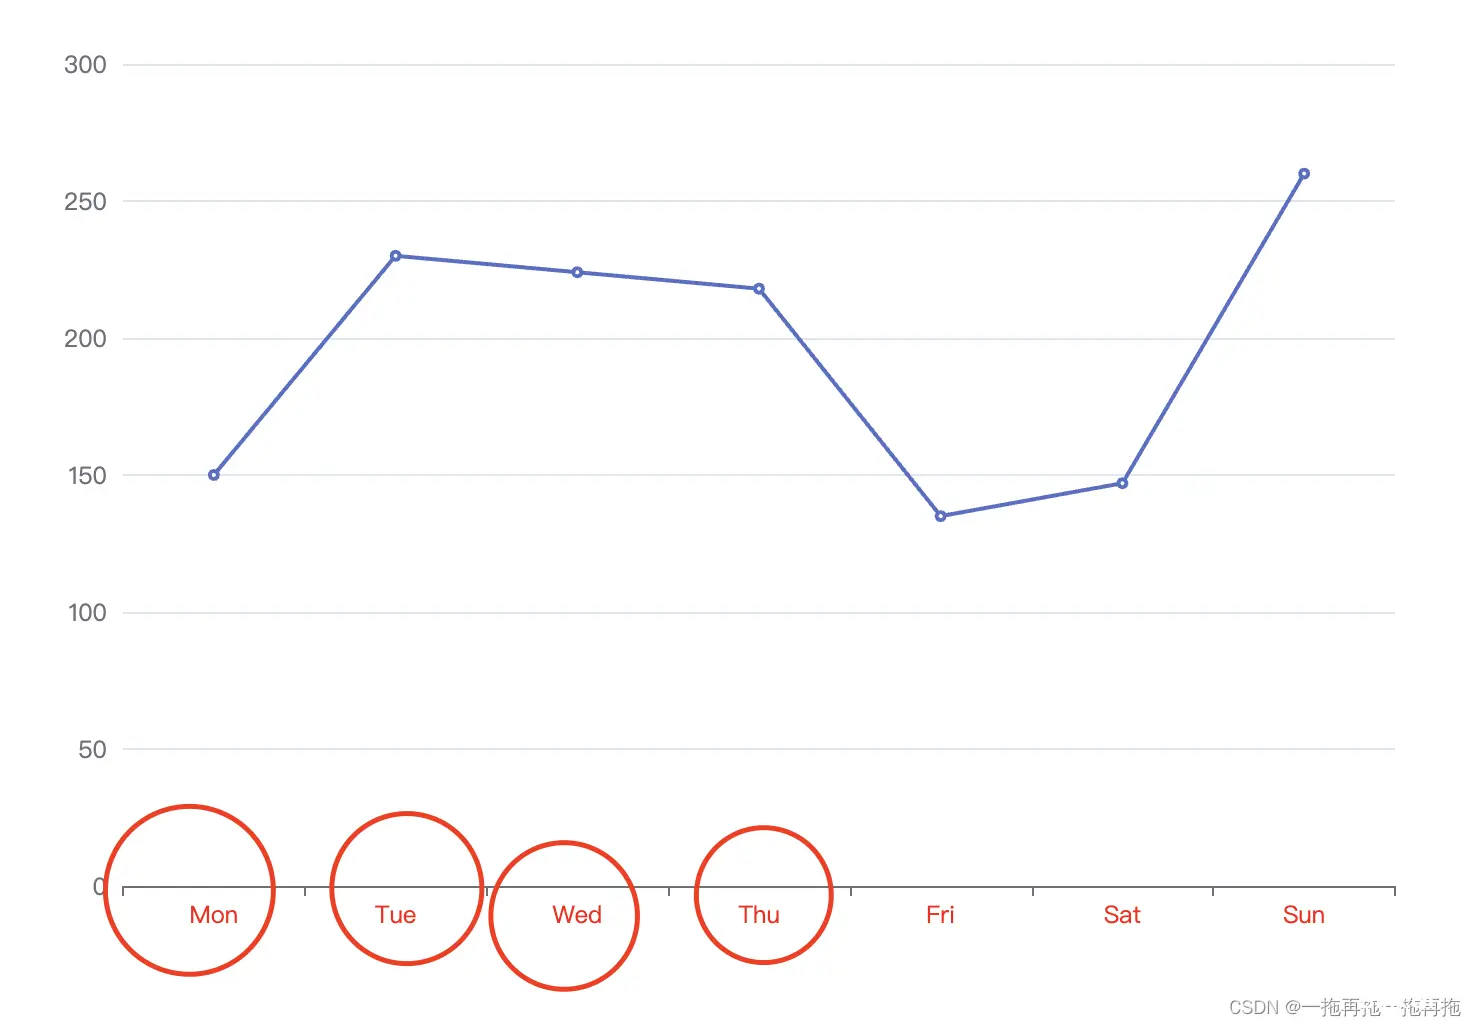
43:x轴内容样式
xAxis: { type: 'category', data: ['Mon', 'Tue', 'Wed', 'Thu', 'Fri', 'Sat', 'Sun'], axisLabel: { textStyle: { color: 'red' } } },
44:持续更新中 …
如果命名不合适,或者遇到这里没有收录的内容,请留言,我会以更快的速度更新。
目前只更新了比较常用的部分,以后会持续更新…
声明
本文内容仅代表作者观点,或转载于其他网站,本站不以此文作为商业用途
如有涉及侵权,请联系本站进行删除
转载本站原创文章,请注明来源及作者。